Makeover Monday 2019/ Week 40: How is London's population expected to change by 2050?
This week’s Makeover Monday’s dataset is about London’s population and how it is expected to change by 2050. The original bar chart shows how London’s total population would change between 2011 and 2015. However, the data provided by the London Datastore contains more details about different components of this change by borough, including population’s age, gender, and country of origin.
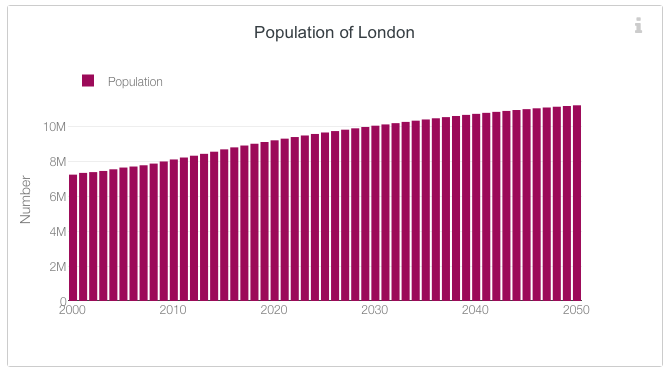
Population of London / Chart by the London Datastore
Original Makeover Monday post and data set on data.world.
What works in this chart?
- The chart clearly shows the expected increase of London’s total population.
What can be improved?
- Colour legend is redundant here as there is only one measure which is already specified in the chart’s title.
- It would be interesting to see not only how the population would change in terms of its total size, but how its different components would change across London boroughs.
My take on the chart
I decided to focus my viz on the population compound annual growth rate (CAGR) to see the annual rate of change in population by borough. The City of London turned out to be the slowest growing borough with CAGR of only 0.2%. This could be related to the large number of offices and public spaces in this area, coupled with high real estate prices for private properties. At the same time the City’s neighbour, Tower Hamlets, is expected to grow the fastest at a CAGR of 1.2%, reaching in 2050 a net growth of +60% relative to 2011.
The butterfly chart on the right provides further insights into how the population is expected to change, this time looking at the population CAGR by gender and age groups. It was interesting to discover that senior groups are expected to grow the fastest for both male and female populations. Across almost all boroughs the 90+ age group is expected to be the fastest growing. You can hover over a borough on the map to see the breakdown by age and gender for this particular borough on the right.
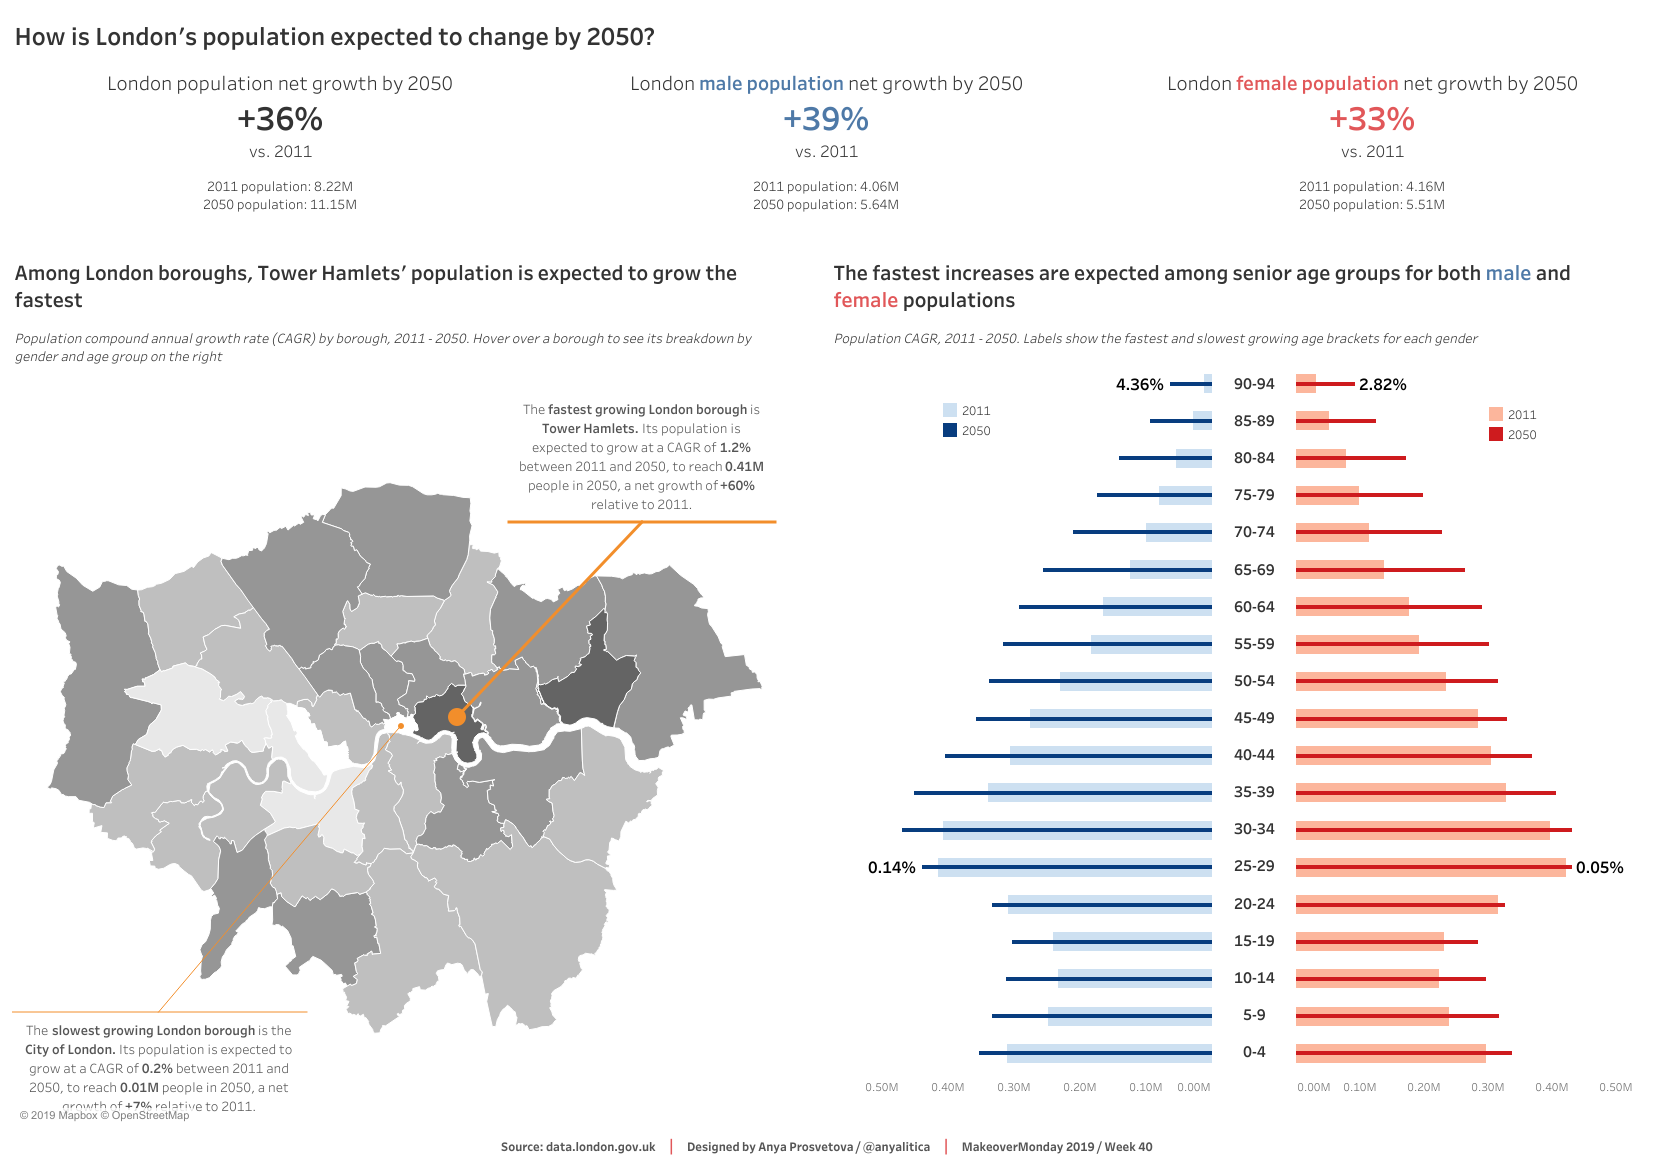
How is London's population expected to change by 2050? / Designed by Anya Prosvetova
You can see the interactive version of this dashboard on my Tableau Public page.