Preppin' Data 2020: Week 1 challenge solution
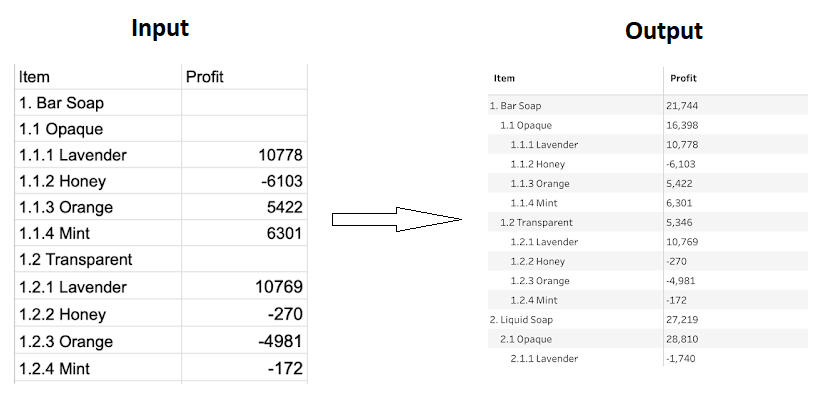
Here is my solution for the first Preppin’ Data challenge of 2020. The goal for this challenge was to calculate total profits for Level 1 and Level 2 of the profit statement’s hierarchy and add leading spaces to visually highlight different levels of this hierarchy (5 spaces for Level 2 items and 10 spaces for Level 3 items).
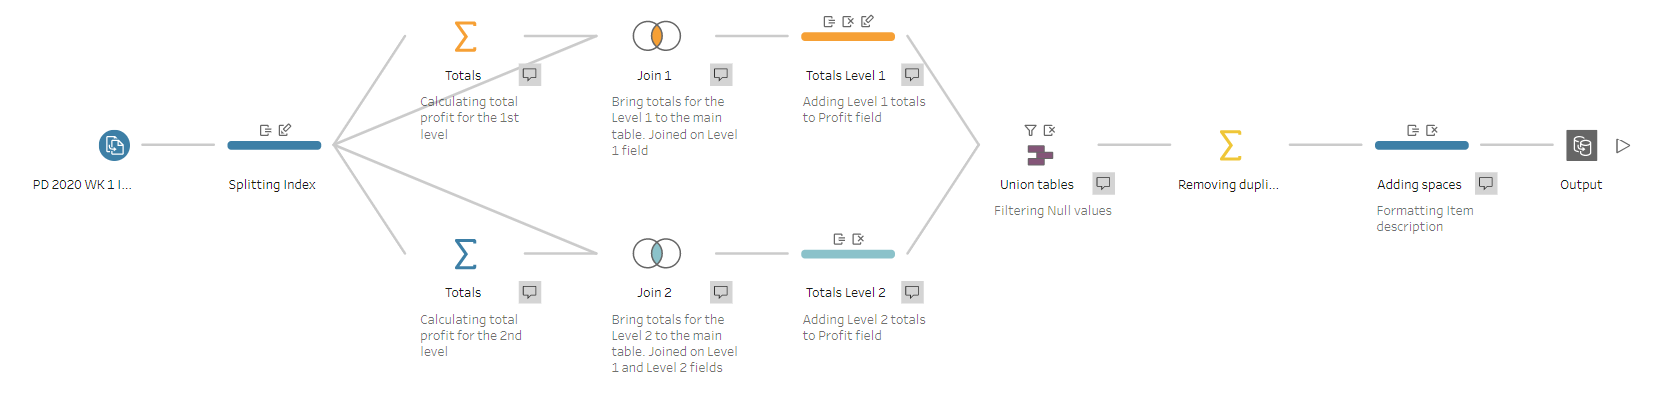
My solution in Tableau Prep
Original challenge and data set on Preppin’ Data’s blog.
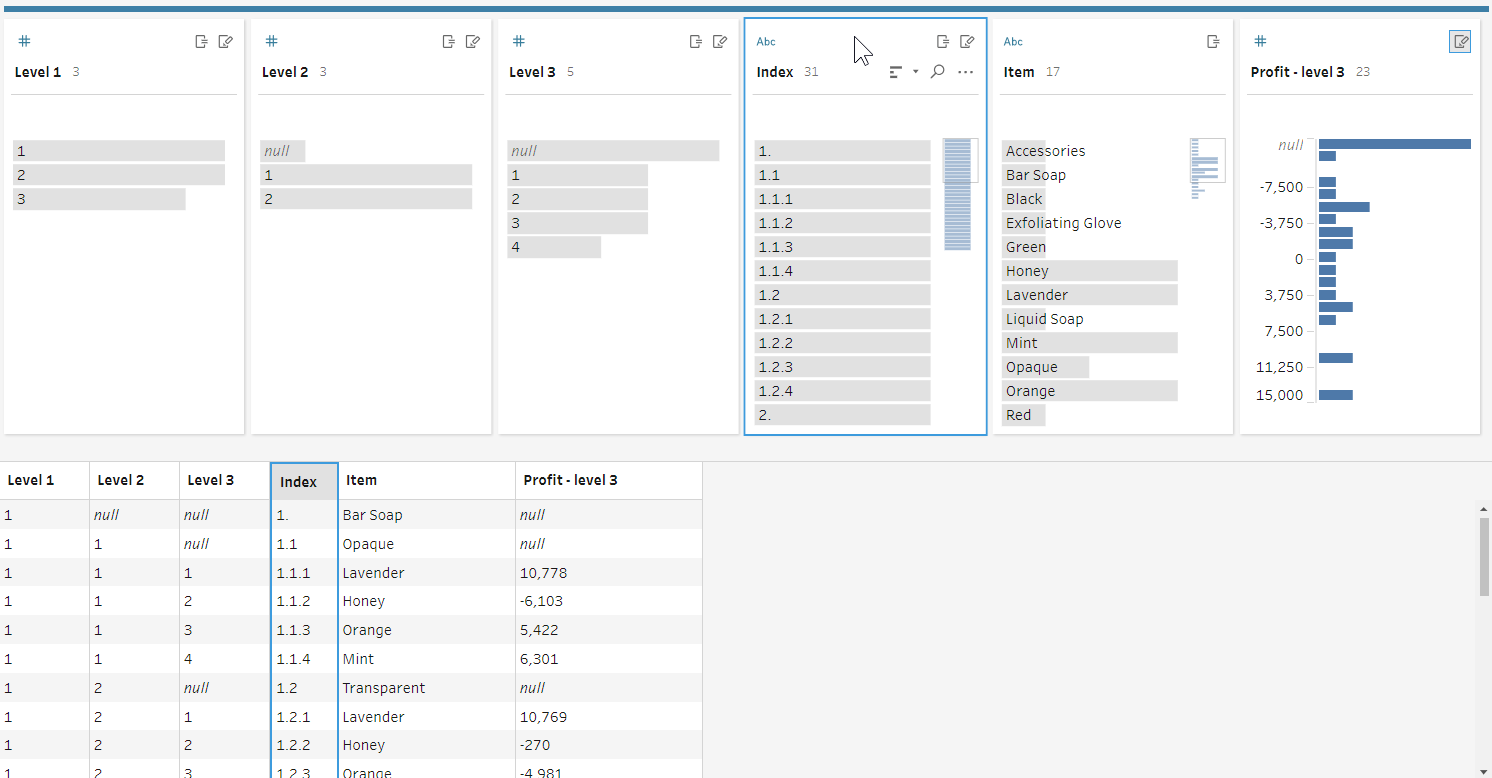
Step 1: Splitting the Item field
To calculate the totals for Level 1 (i.e. Bar Soap, Liquid Soap, Accessories) and Level 2 (i.e., Opaque, Transparent, Exfoliating Glove, and Soap Holder), I started with adding a Cleaning step after the input to split the Item field (using space as a delimiter) and get a new field called Index. Then, I split the Index field into three new fields (Level 1, Level 2 and Level 3) to use them in later steps for calculating totals for Levels 1 and 2.
Step 2: Calculate total profits for Levels 1 and 2
I added two branches from the Cleaning step for two separate Aggregate steps: one for calculating the profit for Level 1 products, and another for the profit for Level 2 products.
For Level 1
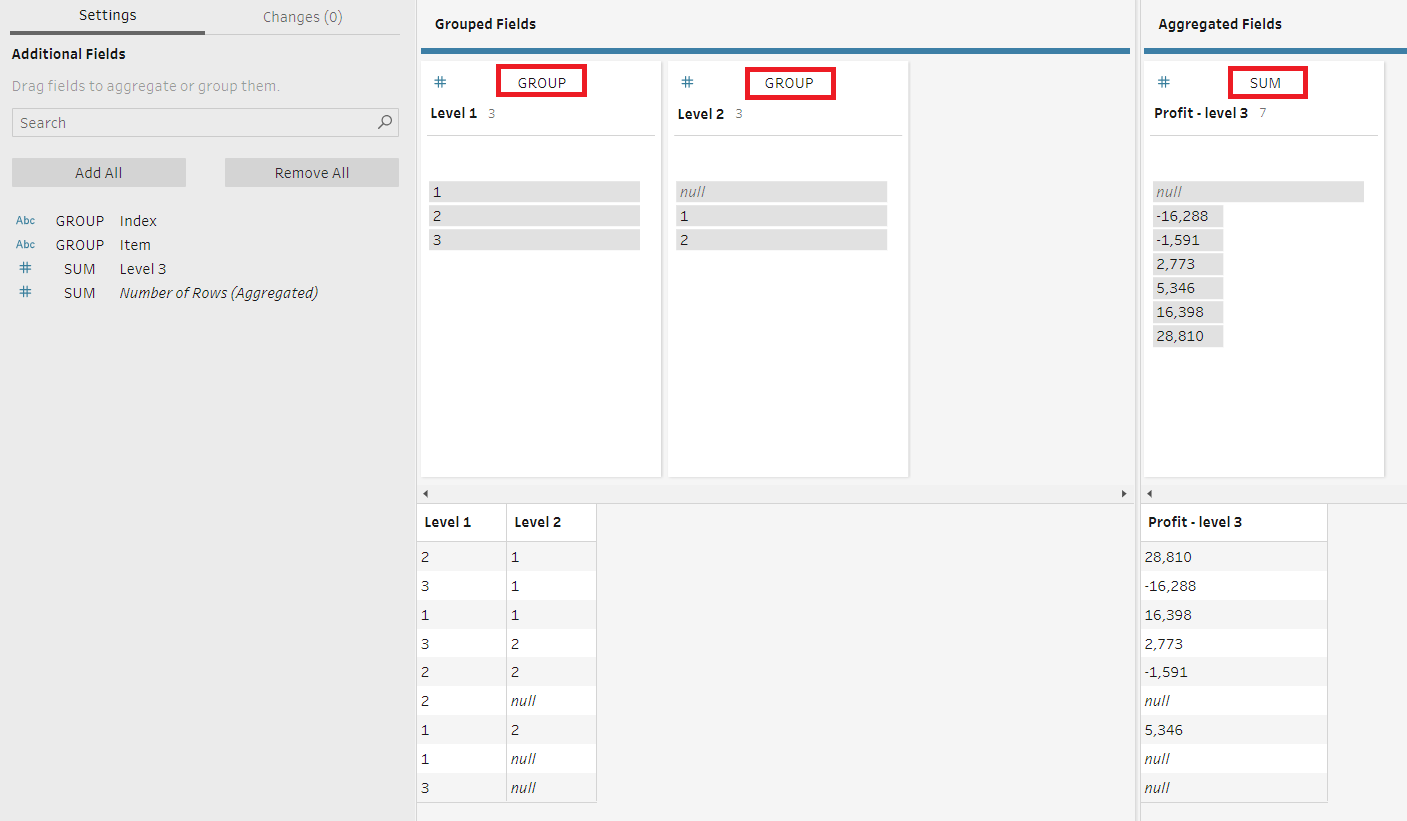
For Level 2
Step 3: Bring the totals to the main data set
After calculating total profits for Levels 1 and 2, I needed to bring them back to the main data set. To do so, I joined each Aggregate step back to the earlier Cleaning step, i.e. the main data set.
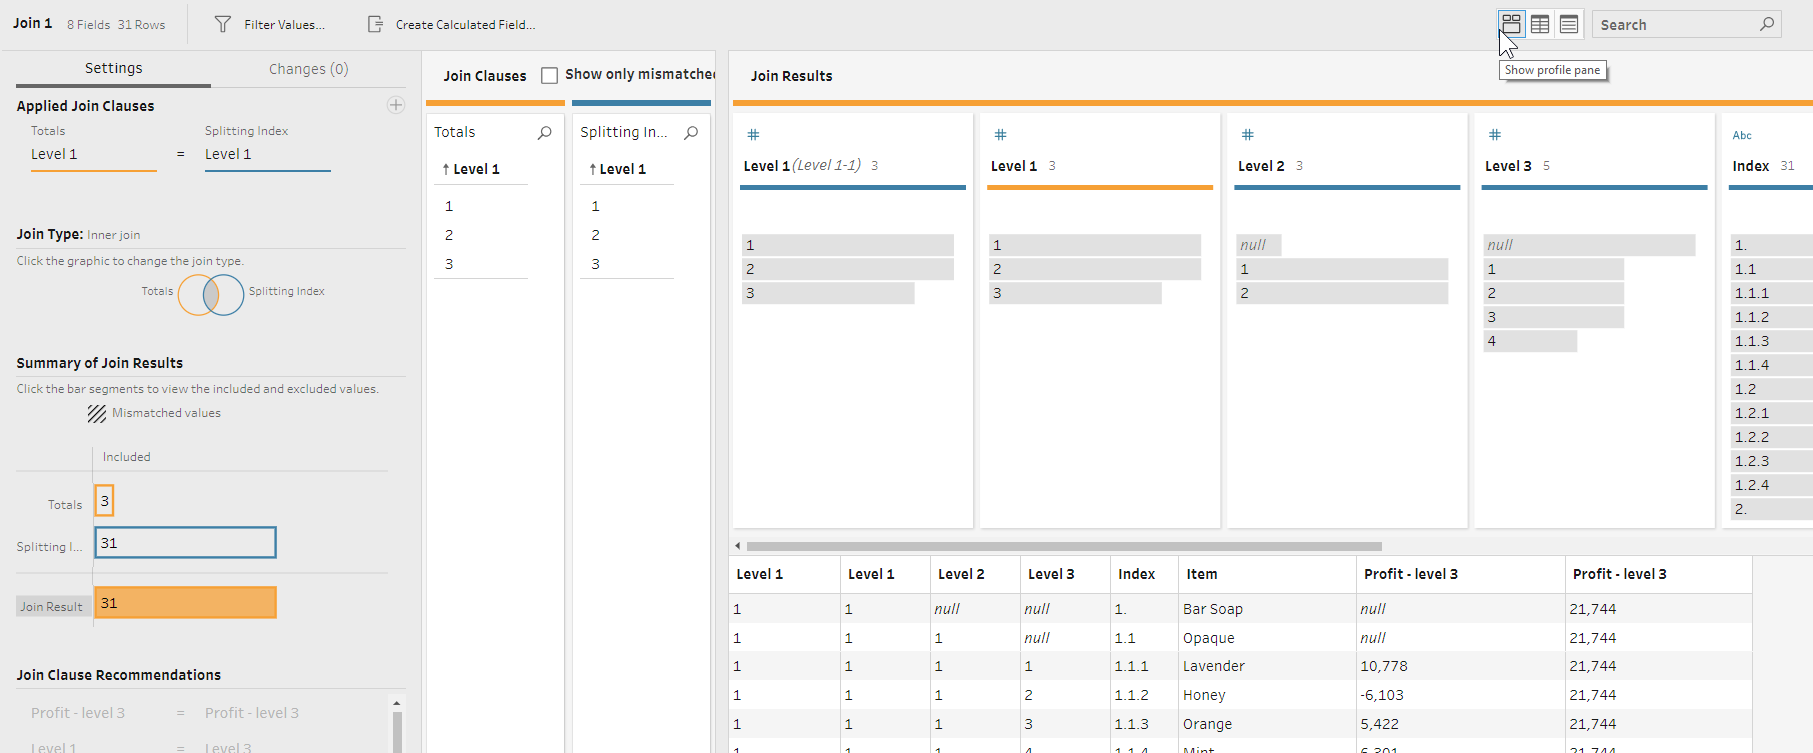
For Level 1
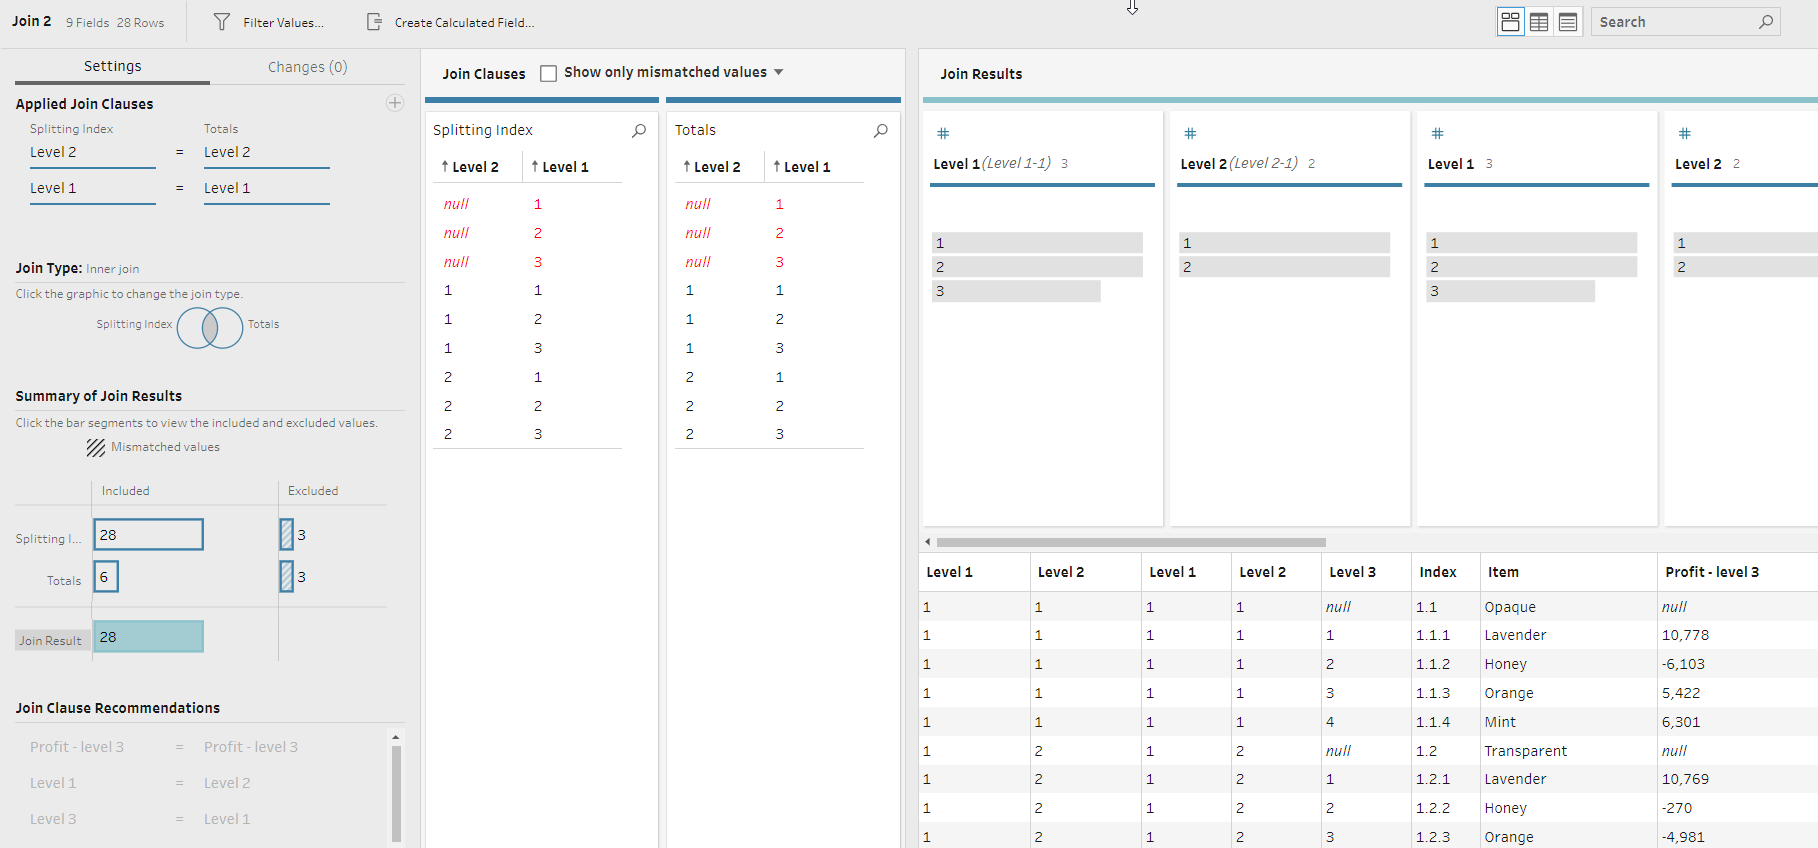
For Level 2
Once total profit numbers were added to the main data set, I added two new Cleaning steps and created calculated fields to move the totals for Levels 1 and 2 to the same Profit field.
For Level 1
IF ISNULL([Level 2]) AND ISNULL([Profit - level 3-1]) THEN [Profit - level 3] ELSE [Profit - level 3-1] END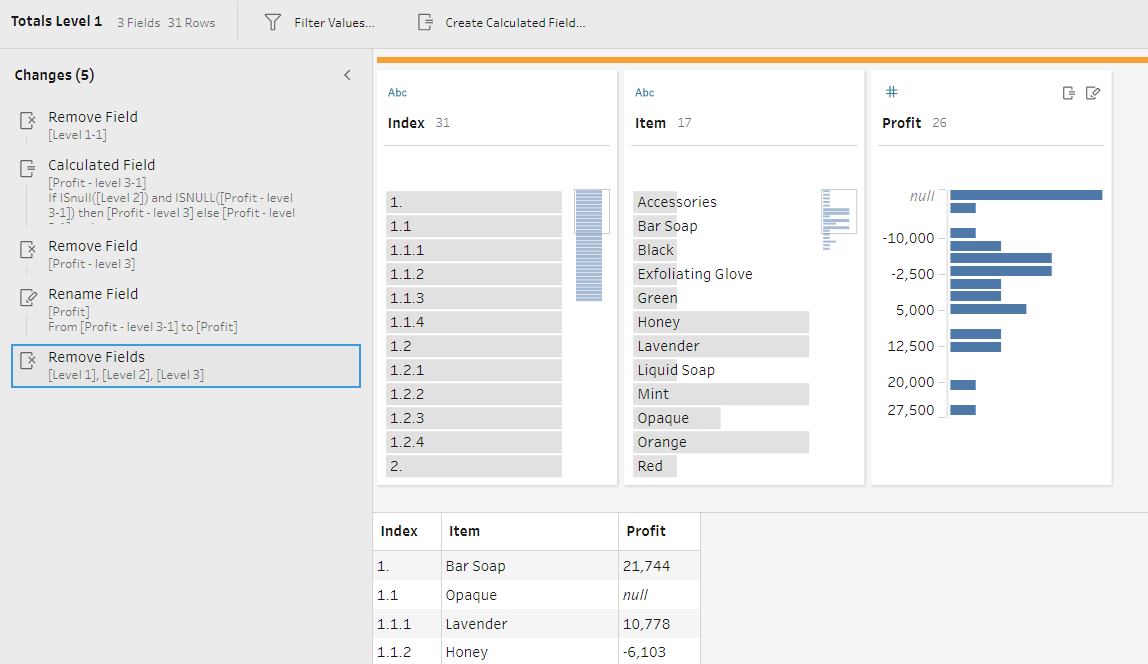
For Level 2
IF ISNULL([Level 3]) AND ISNULL([Profit - level 3]) THEN [Profit - level 3-1] ELSE [Profit - level 3] END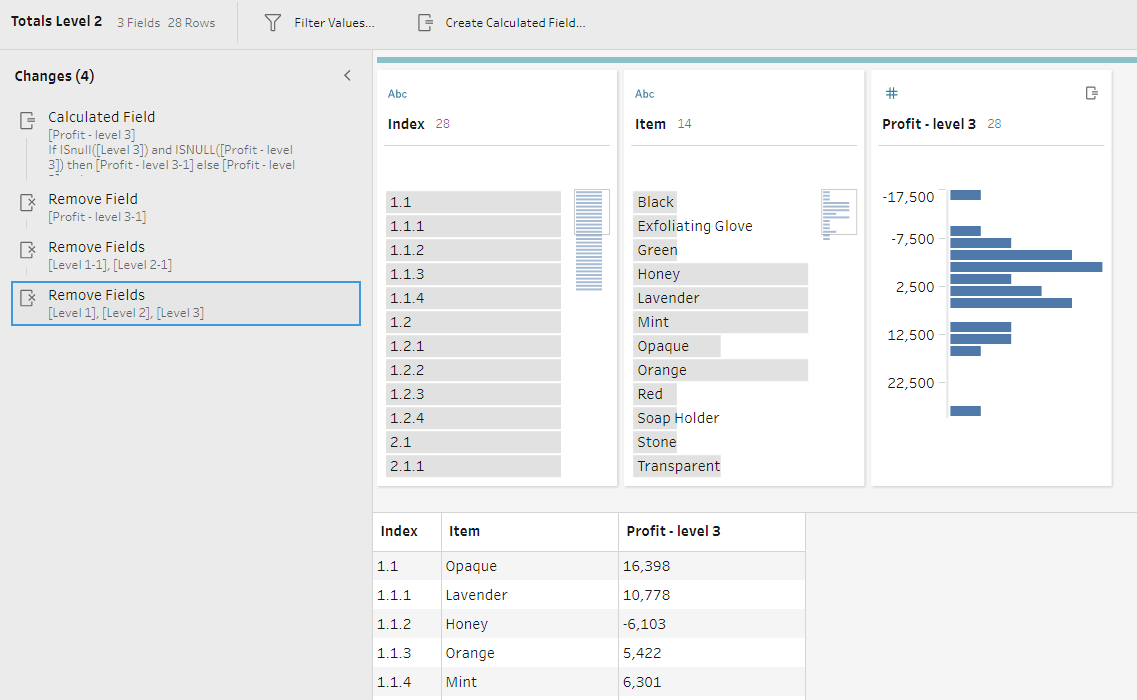
Step 4: Union two tables
Now I could bring these two updated tables back together to create the final profit statement. After adding the Union step, I filtered all null values from the Profit field as by now there were no null values I needed to keep.
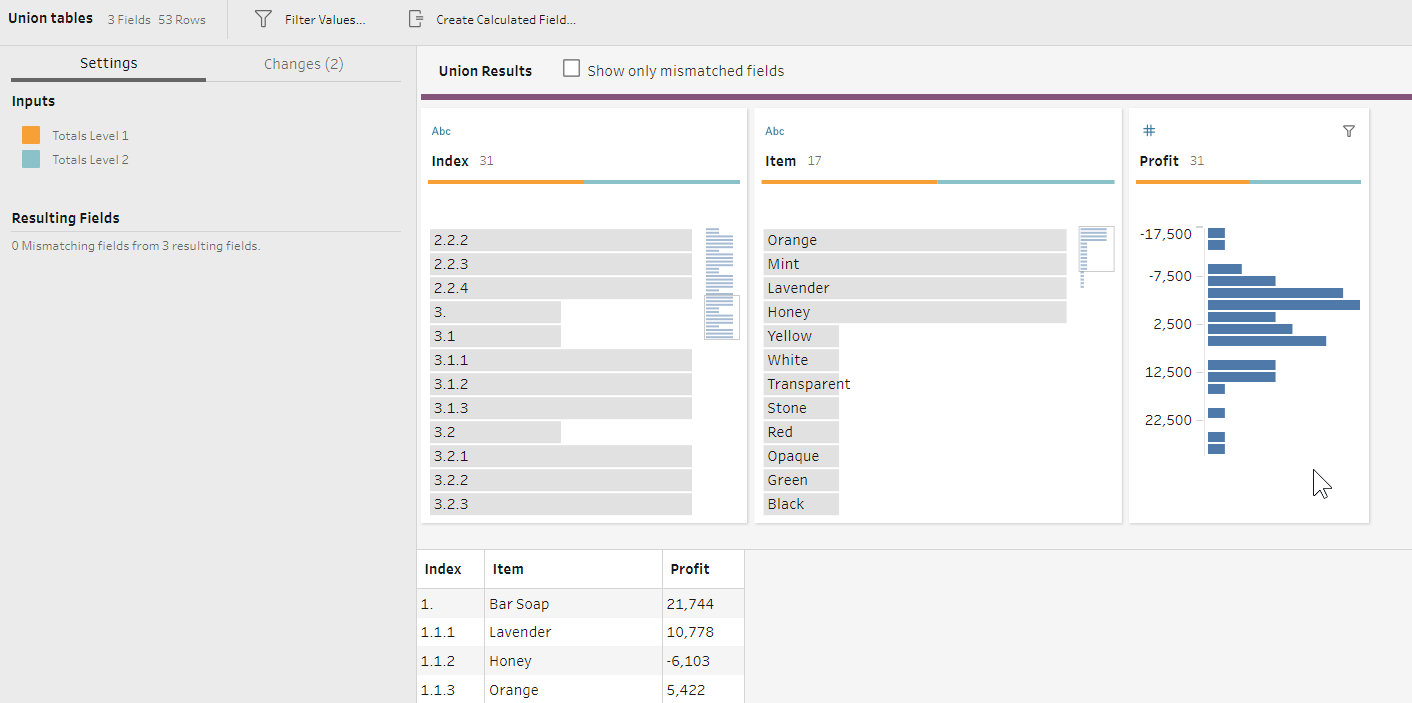
Union of the two tables
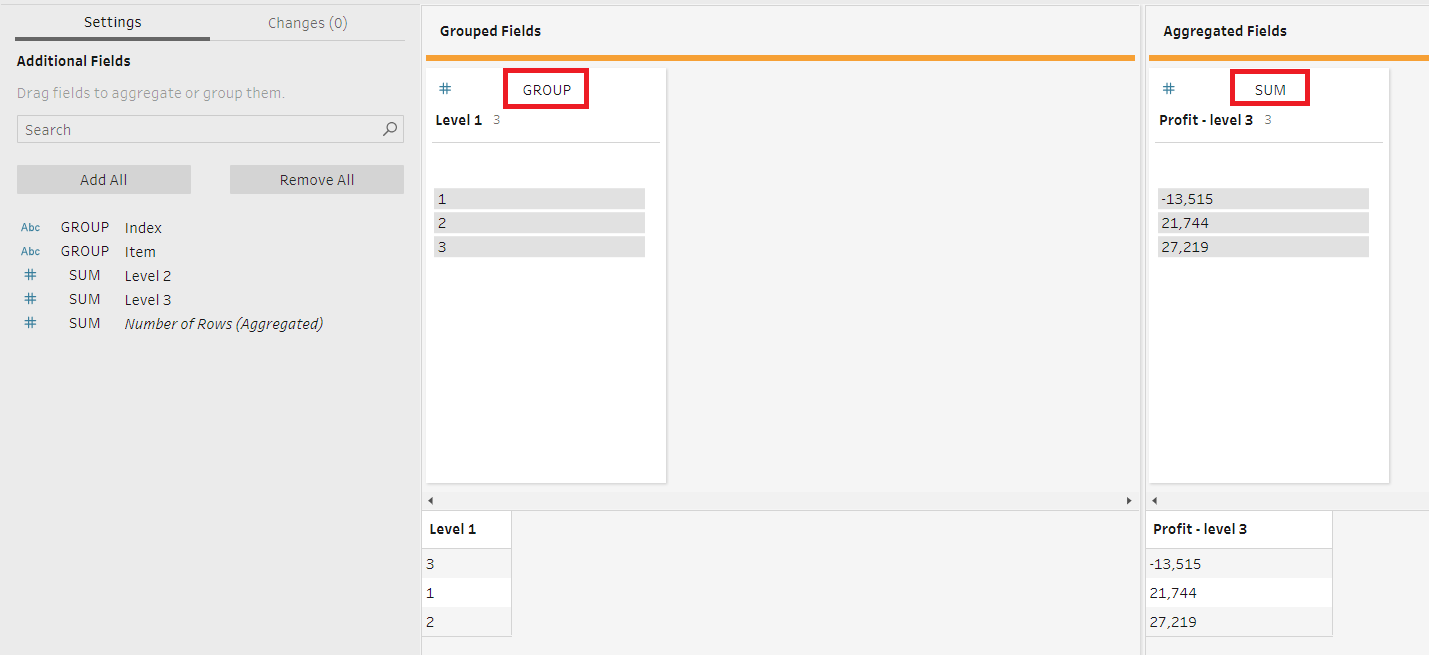
Step 5: Removing duplicates
The original profit statement had 31 rows, but now, after all the manipulations, there were 53 rows. I removed duplicate values by adding an Aggregate step and grouping all the fields in my data, except for the Number of Rows field generated by Tableau Prep. Now I was back to 31 rows.
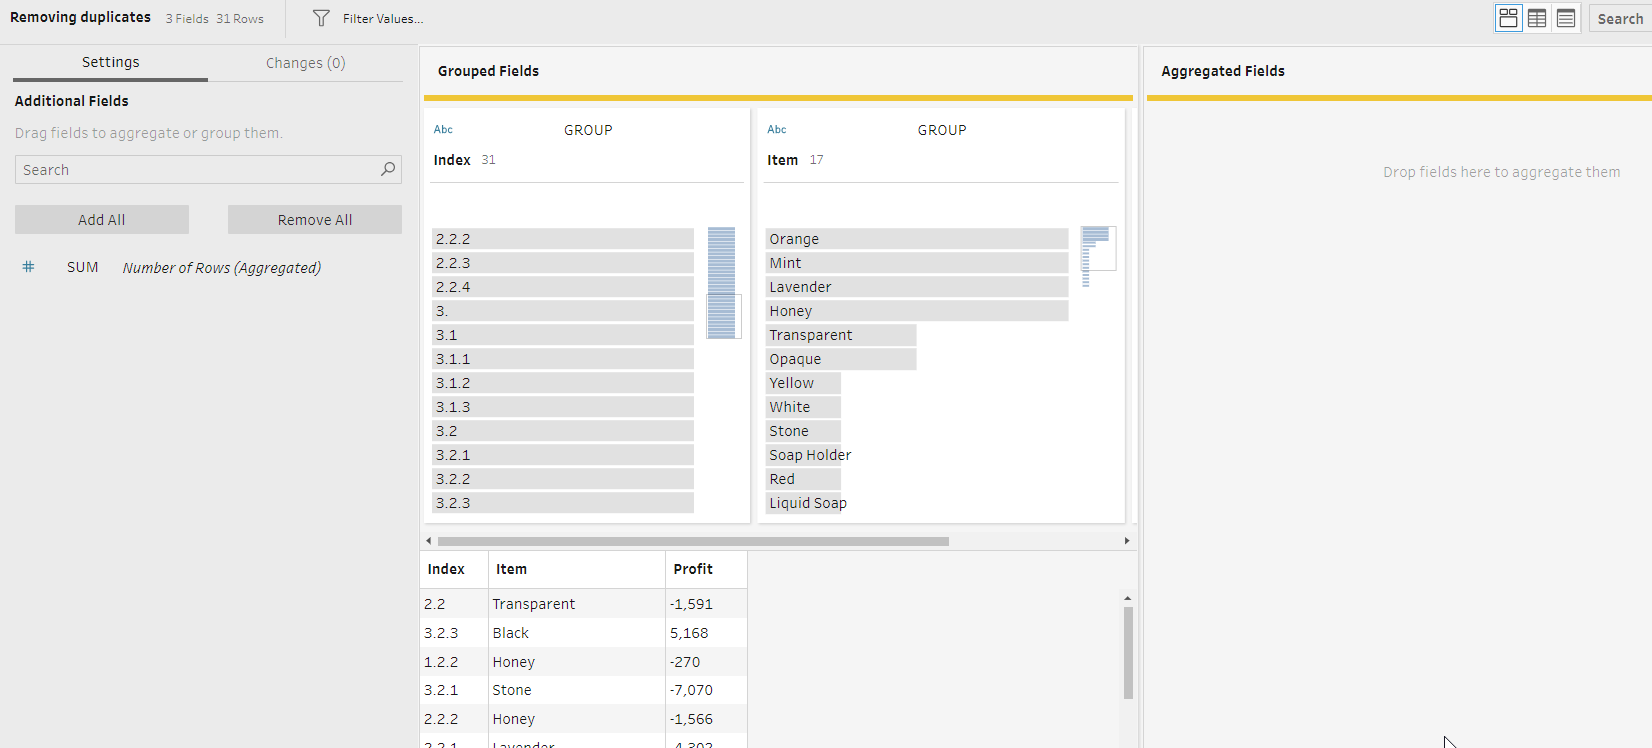
Removing duplicates
Step 6: Adding leading spaces to the Item field
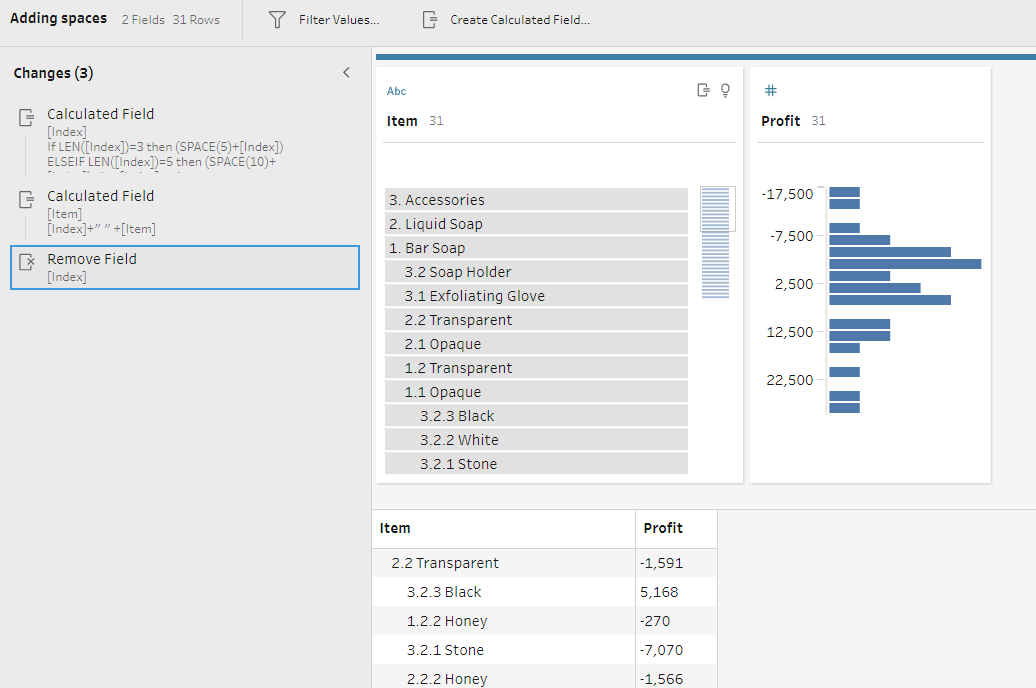
The last thing was to add leading spaces to the Item field to format it as a traditional profit statement with visually indented levels of hierarchy. There is a handy formula in Tableau Prep called SPACE. I added a new Cleaning step and created a calculated field as below to update the existing Index field:
IF LEN([Index])=3 THEN (SPACE(5)+[Index]) ELSEIF LEN([Index])=5 THEN (SPACE(10)+[Index]) ELSE [Index] ENDThen I concatenated Item and Index fields to get the combined Item field.
After outputting the updated data set as a .hyper file (to keep the leading spaces), I brought it into Tableau Desktop and all the fields were correctly sorted.
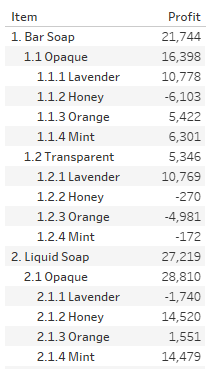
Profit statement in Tableau Desktop. Note the profit figures for Level 1 and Level 2 items.
You can download the completed workflow for this challenge in my GitHub repository. Let me know if you have any questions.