Preppin' Data 2020: Week 8 challenge solution
Here is my solution for Peppin’ Data 2020, Week 8. The goal for this challenge was to combine several weekly sales reports together, and compare them against budget and profit goals.
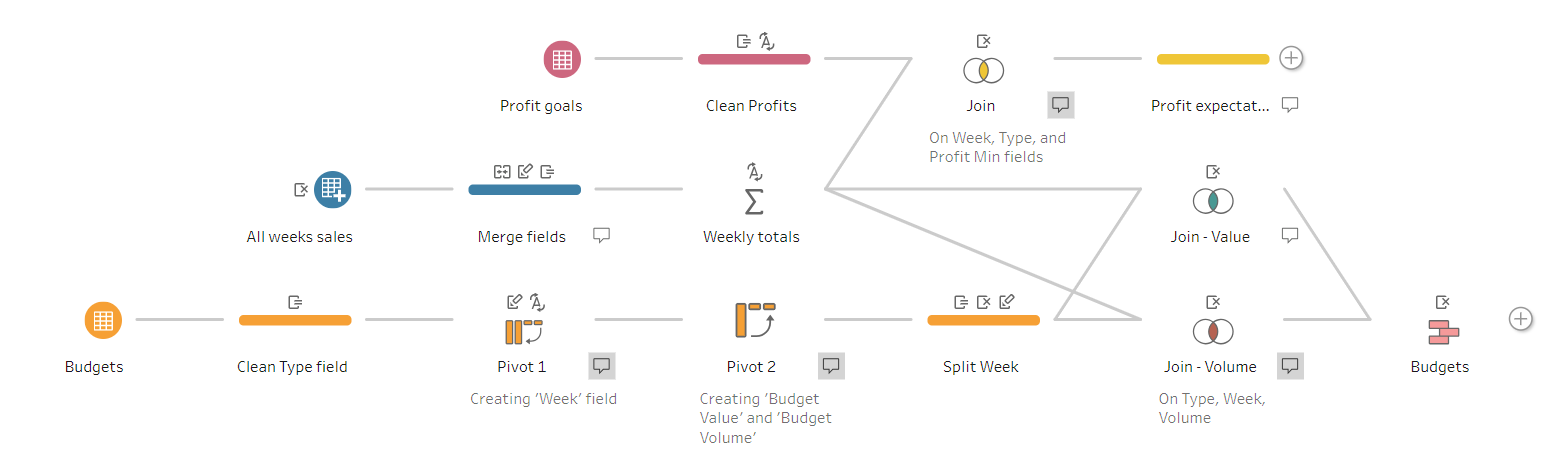
My solution in Tableau Prep
Original challenge and data set on Preppin’ Data’s blog.
Step 1: Inputting sales reports for all 8 weeks
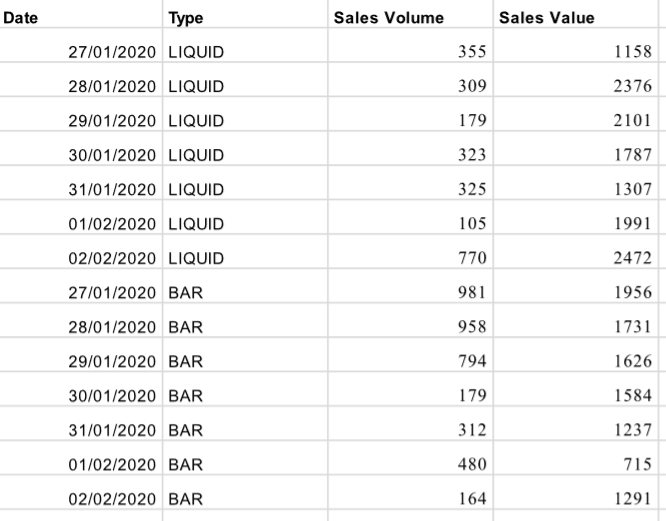
Sales reports are well formatted, but come as separate Excel sheets
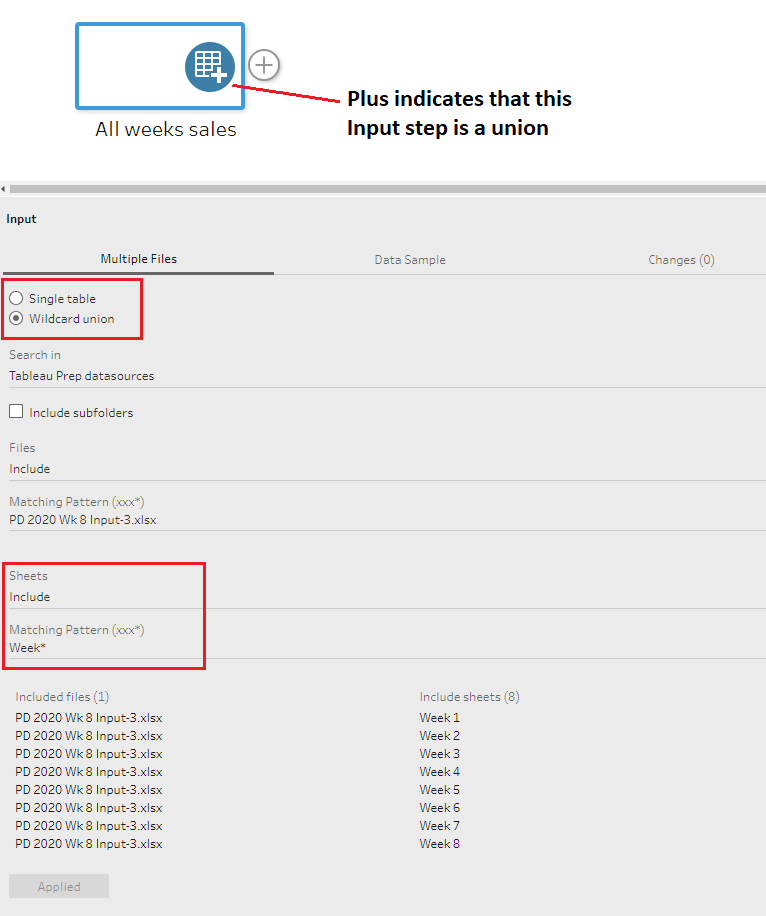
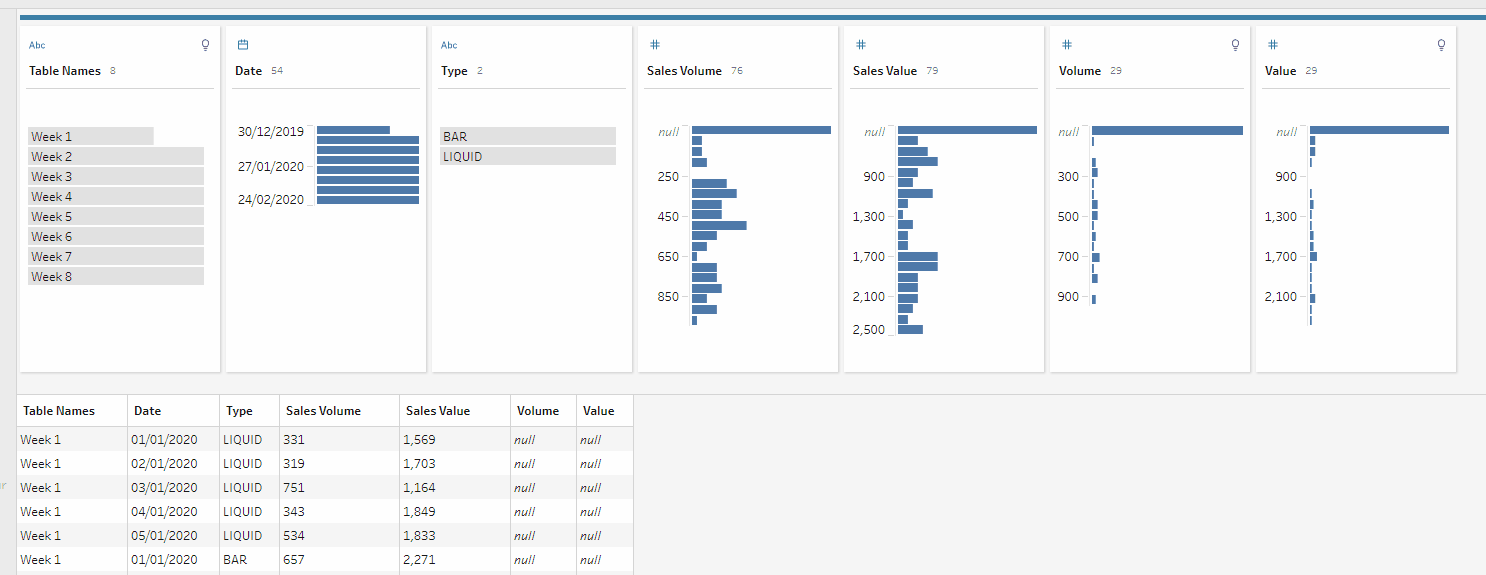
After I connected to the input file for this challenge in Tableau Prep, I inputted in one of the tabs with weekly sales data. In the Input step’s menu I selected the Wildcard union option and configured the Input dialogue to bring all the sheets from the input document which names that match the following pattern: Week* (i.e. all sheets which name starts with ‘Week’). After you hit the Apply button, notice that the Input step’s icon now has a plus sign indicating that it’s a union rather than a single file input. I also renamed this Input step (by double clicking on the original name of the step) to reflect that it’s all sales.
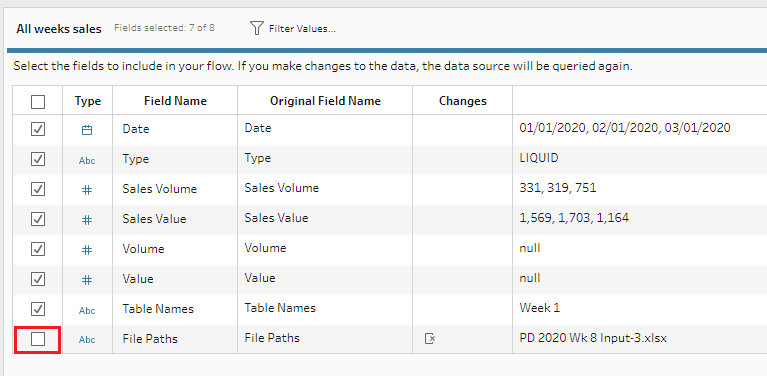
When performing a union, Tableau Prep generates two new fields in the data set: File Paths (the name of the input file; in this case: PD 2020 WK 8 Input-3.xlsx) and Table Names (names of individual sheets from the input file; in this case: Week 1, Week 2, etc.). Let’s remove the File Paths field by unticking the box next to its name, but keep the Table Names field.
Step 2: Cleaning sales data for analysis
When we union several tables together, it means that we simply stack one table on top of another. To get a correct result after unioning several tables, we need to make sure that our tables have the same number of fields, and these fields hold data of the same data type. When working with unions in Tableau Prep, we also need to remember that fields should have identical names, otherwise they will be seen as different fields.
This happened here as in some sales reports fields are called Sales Volume and Sales Value, while in other report fields with the same type of data are simply called Volume and Value. As you can see from the image below, Tableau Prep thinks that these are two separate fields, and shows Null in the fields that didn’t match across reports in the union.
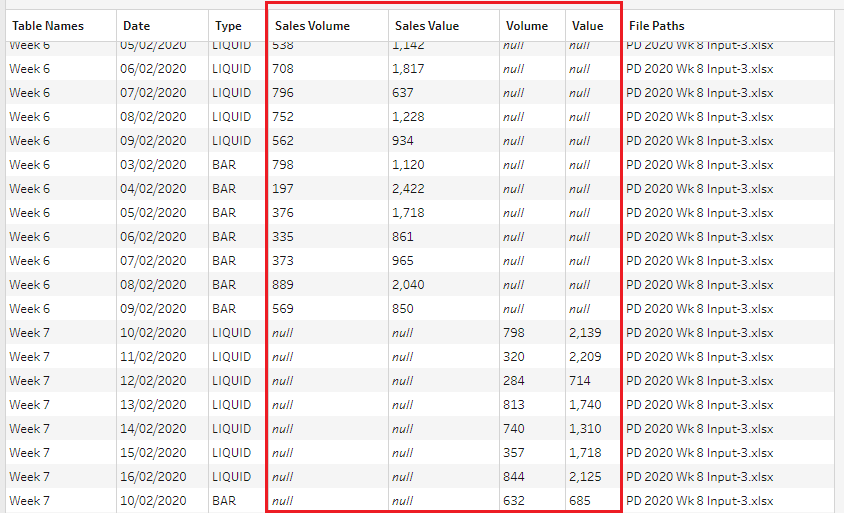
Combined table with mismatched fields
To solve this, you can either rename the fields in the Input step, or merge them later in the Cleaning step, as I did in this case. I find the latter way more reliable as you can see what kind of data is in each field before merging them.
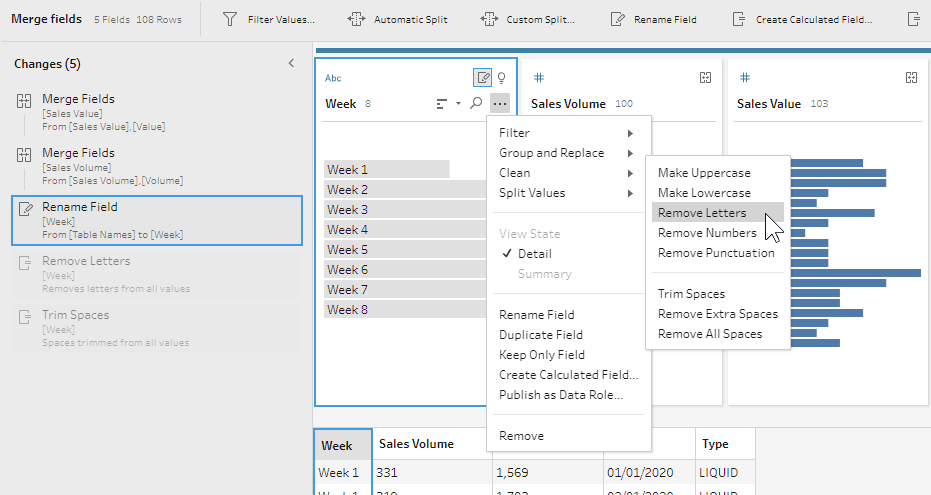
To merge fields in Tableau Prep, left-click on the field you want to merge and drag it onto the field you want to merge it with. To save time and avoid renaming fields after merging, remember that the new merged field will take the name of the field you dragged another field onto. For example, I dragged the Volume field onto the Sales Volume field, and the combined field is called Sales Volume.
Merging mismatched fields
To finish this step, I renamed the Table Names field as Week. Then I removed all letters and spaces from this field to keep only the week’s number. To do so, click on the three dots icon in the Week field’s header, and select Clean > Remove Letters and Clean > Trim Spaces.
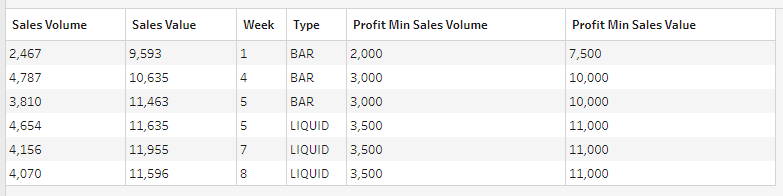
Step 3: Calculating weekly sales volume and value figures
Once the data was ready, I brought in the Aggregate step to get weekly sales and value figures for each week and product type. Here you need to group by the Week and Type fields, and calculate the sum of the Sales Volume and Sales Value fields. Now that we have weekly sales figures we can compare them against the budget and profit targets in further steps.
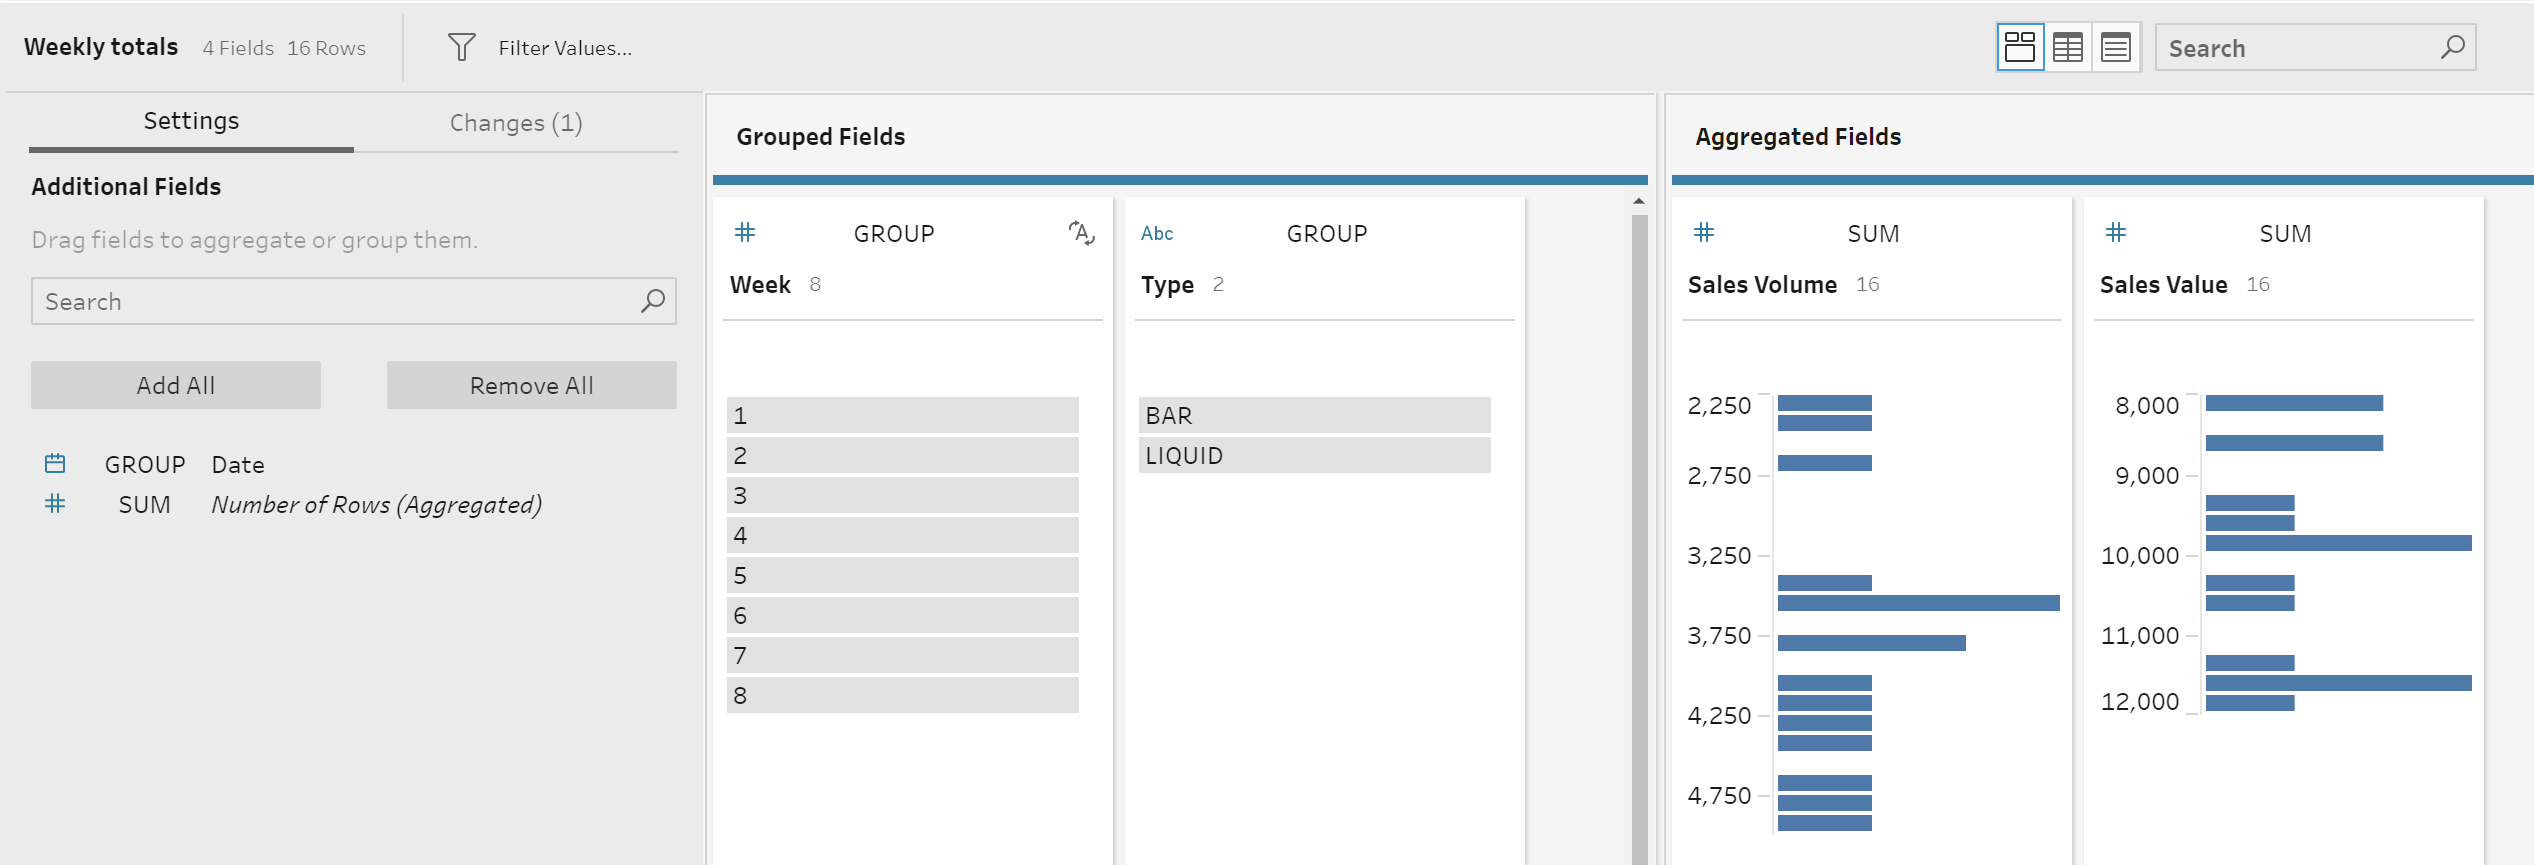
Configuration of the Aggregate step
Step 4: Inputting budget and profit goal tables
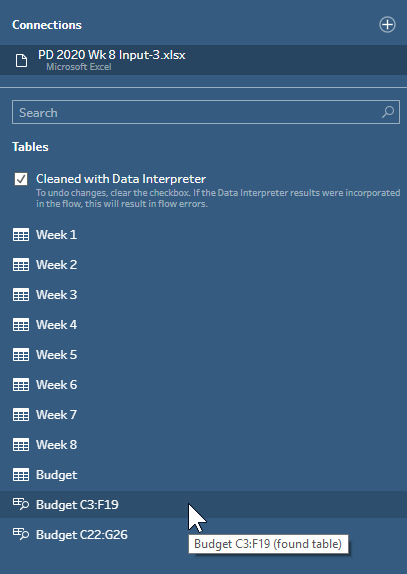
As you can see from the image below, the goals sheet is not formatted in a suitable way for analysis because it has many empty fields and rows. In addition, both tables are on the same sheet, so Tableau Prep sees them as one table when you try to input it. To solve this issue we need to use the Data Interpreter functionality which you might be familiar with from Tableau Desktop.
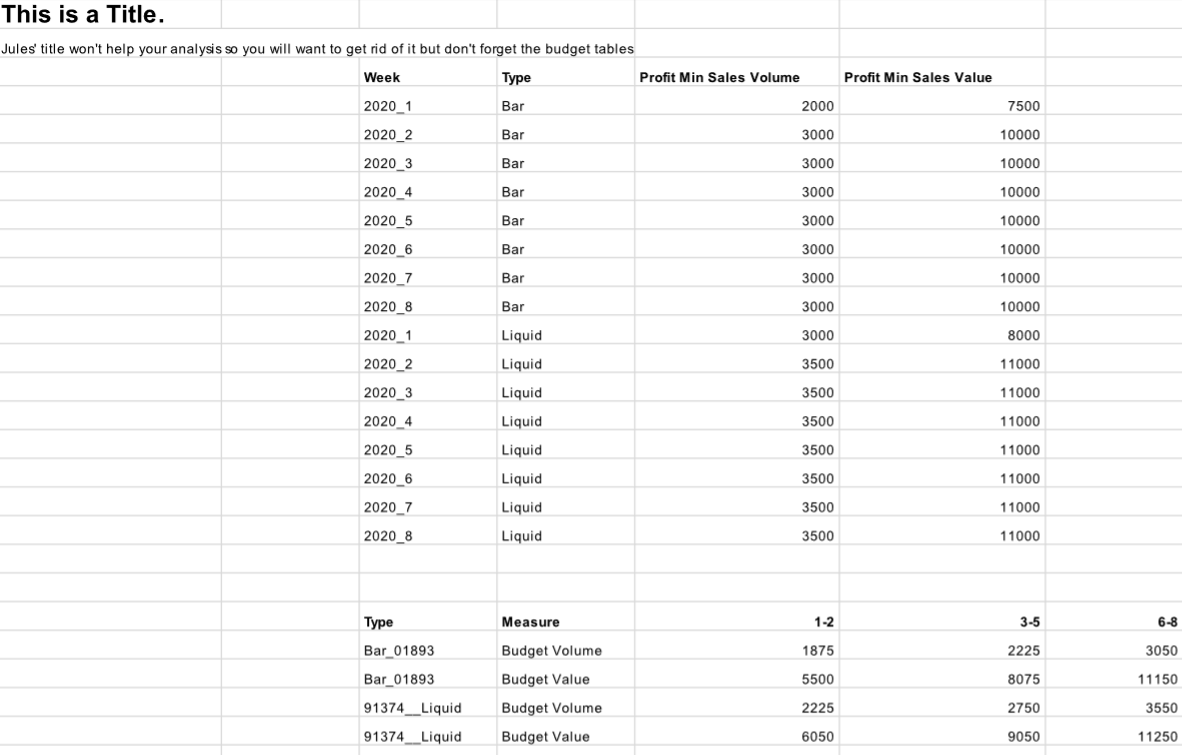
Budget and profit tables are in the same sheet, and need some formatting before they can be used for analysis
To use Data Interpreter, go to the blue Connections pane on the left side, and make sure that the Use Data Interpreter box is checked. Now you can see that Tableau Prep found two tables in the Budget sheet: Budget C3:F19 and Budget C22:G26. Let’s input these tables into our workflow as two separate Input steps instead of using the original Budget sheet. I recommend renaming these inputs as Profit goals and Budgets to make it clear what kind of data each input holds.
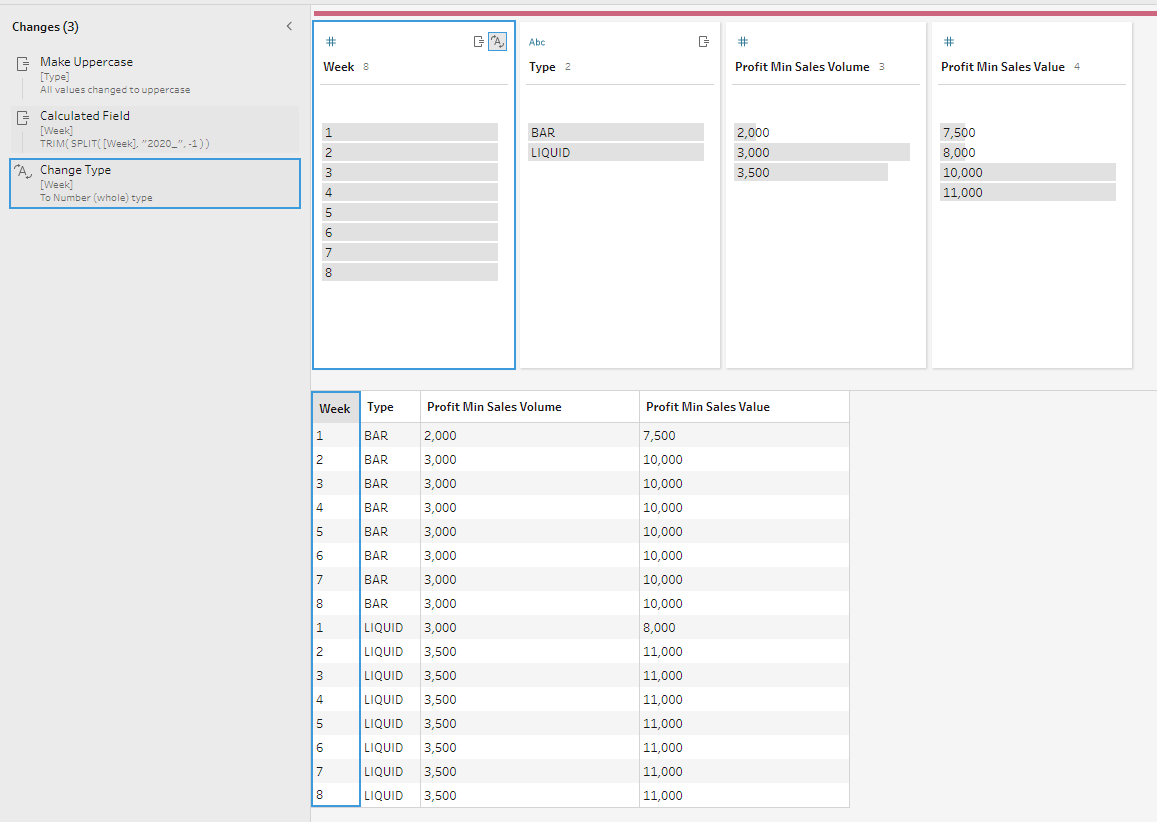
Step 5: Cleaning profit goal tables
Let’s start with changing the case for the Type field to uppercase so it matches the Type field in the sales report table we worked on earlier. To do so, click on the three dots icon in the Type field header, and select Clean > Make Uppercase.
Now we need to update the Week field so it’s just a week’s number, for example ‘1’ instead of ‘2020_1’. To avoid creating duplicated fields, let’s write the following calculated field that I called Week (same as the current field) so the calculation’s result replaces the original Week field:
TRIM(SPLIT([Week], "2020_", -1)) In this calculation, we say that our delimiter is '2020_', and we want to go from the end of the string and extract all characters before the first appearance of our delimiter (that’s why we use '-1' in the calculation). This will keep only the actual week’s number in the Week field now. To conclude this step, we need to change the data type of the Week field to Number (whole) to make sure it matches the Week field in the sales report table.
Step 6: Identifying weeks where profit goals have been exceeded
Now when our profit goals data is ready, we need to compare it with our actual sales data to identify during which weeks our profit goals have been exceeded for both value and volume. For that we need to join the Profit goals table with the All weeks sales table we worked on earlier.
Let’s bring in the Join step and connect these two tables.
Joins functionality in Tableau Prep allows you to use not only ‘equal to’ conditions in join clauses, but also different logical operators to choose what data you’d like to bring into your analysis. I recommend reading this blog post on Preppin’ Data’s website to learn more about advanced joins in Tableau Prep.
In this challenge, we need to use a multiple clause join for our sales and profit goals tables:
- Week and Type fields from both tables should be equal
- Profit Min Sales Value field (from the profit goals table) should be less than Sales Value (from the sales table)
- Profit Min Sales Volume field (from the profit goals table) should be less than Sales Volume (from the sales table)
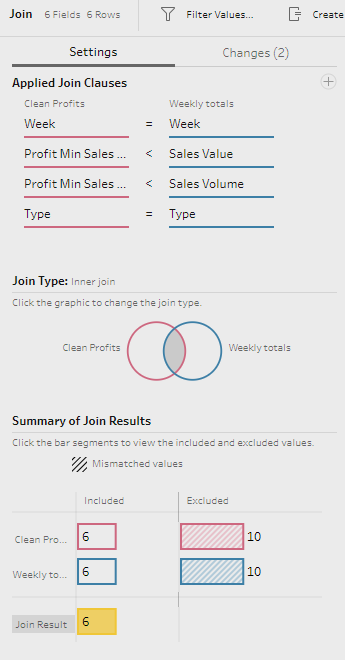
Multiple clause join allows you to filter the results of the join
And, after deleting some duplicated fields, we have our first required output for the challenge as below:
There are 6 weeks where profit goals have been exceeded
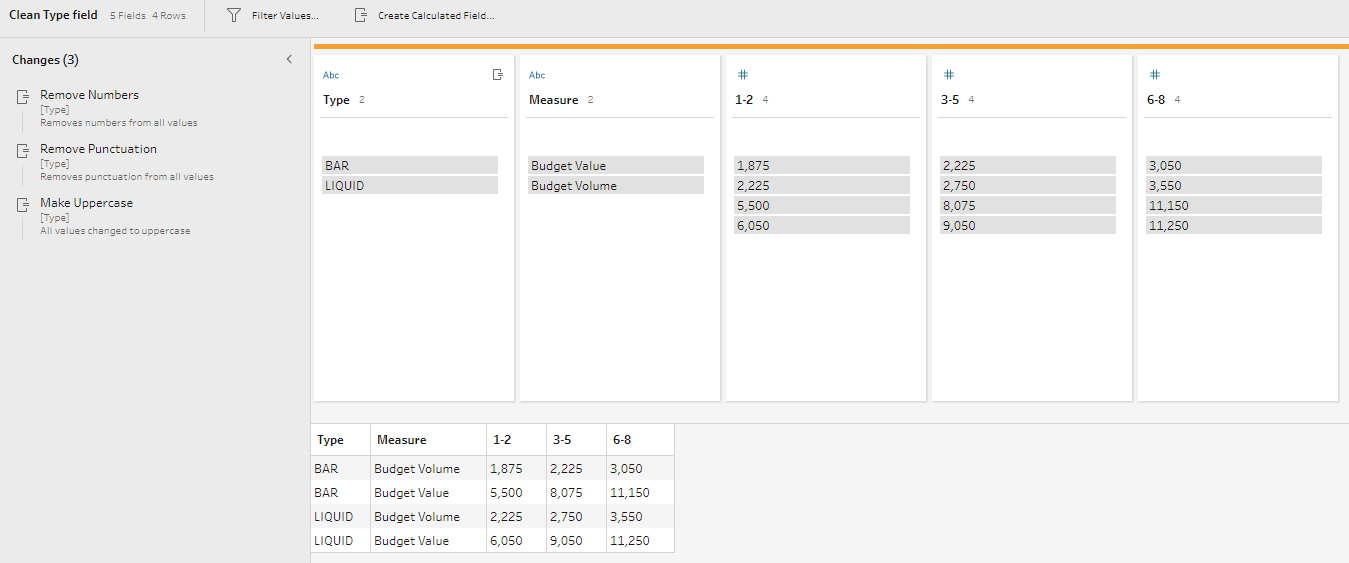
Step 7: Cleaning budget tables
Now we need to take care of the second output, and see in which weeks the budget target wasn’t reached for either value or volume. Let’s look at our Budget input. First we need to clean the Type field so it matches other tables, i.e. it should be ‘BAR’ or ‘LIQUID’ instead of ‘Bar_01893’ and ‘91374_Liquid’ as it is now.
To do so, click on the three dots icon in the Type field’s header, and select Clean > Remove Numbers, then Clean > Remove Punctuation, and finally Clean > Make Uppercase.
Step 8: Reshaping budget tables - pivoting columns to rows
As you see from the step above, we need to reshape the budget table to have a Week field as well as Budget Volume and Budget Value as two separate fields. Let’s start with the Week field.
Now there are 3 fields that give a range of weeks for which the budget is set: 1-2, 3-5, and 6-8. Let’s add the Pivot step after the Cleaning step, and pivot these 3 fields, choosing Columns to Rows pivot type.
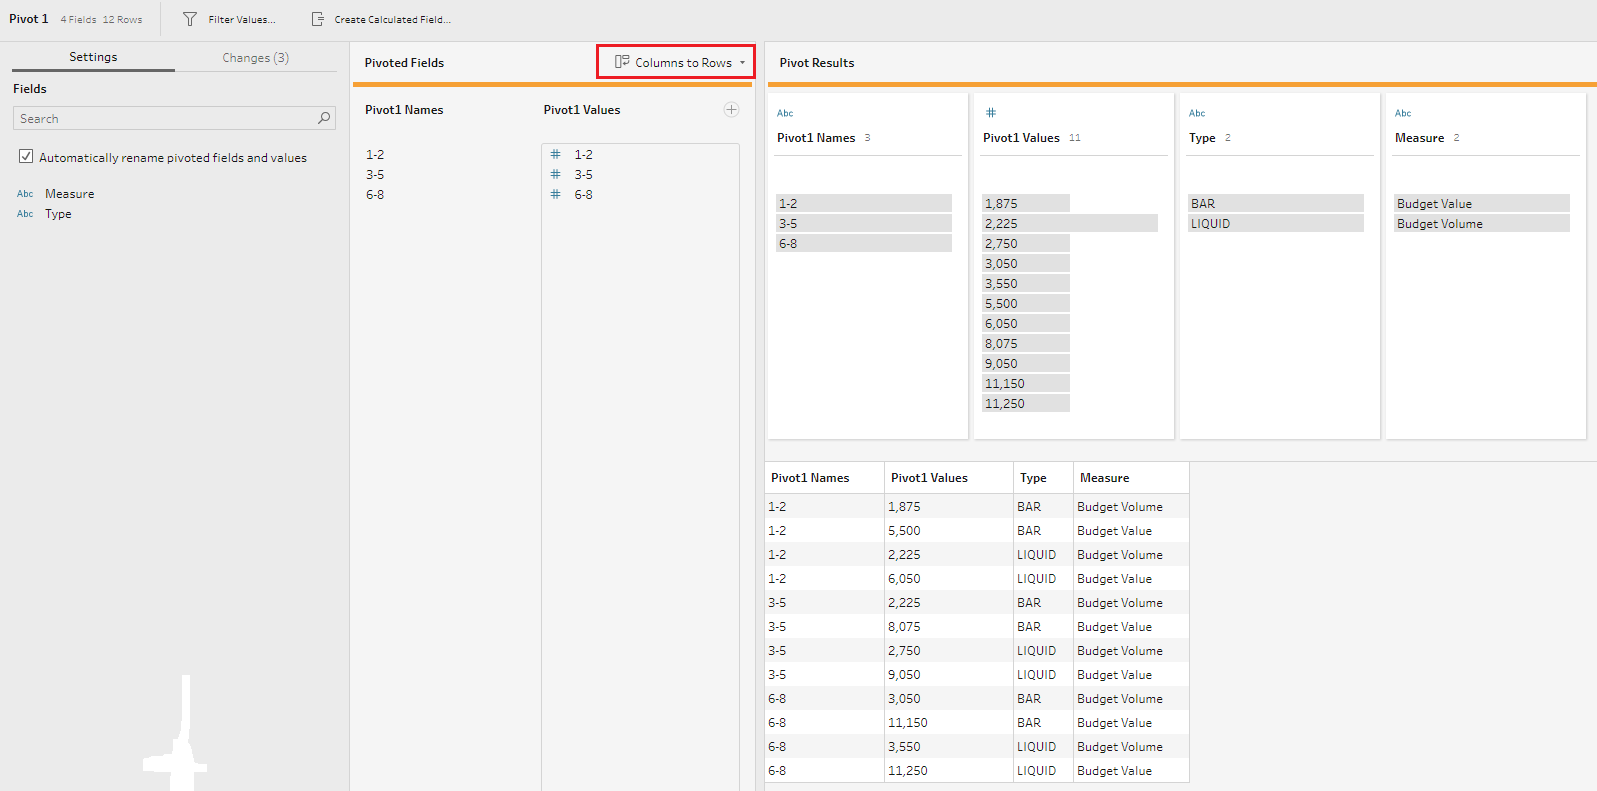
Now we have a separate field with weeks’ numbers (Pivot1 Names) and corresponding budgets (Pivot1 Values). I renamed these fields to Week and Value accordingly, and changed the data type of the Value field to Number (whole).
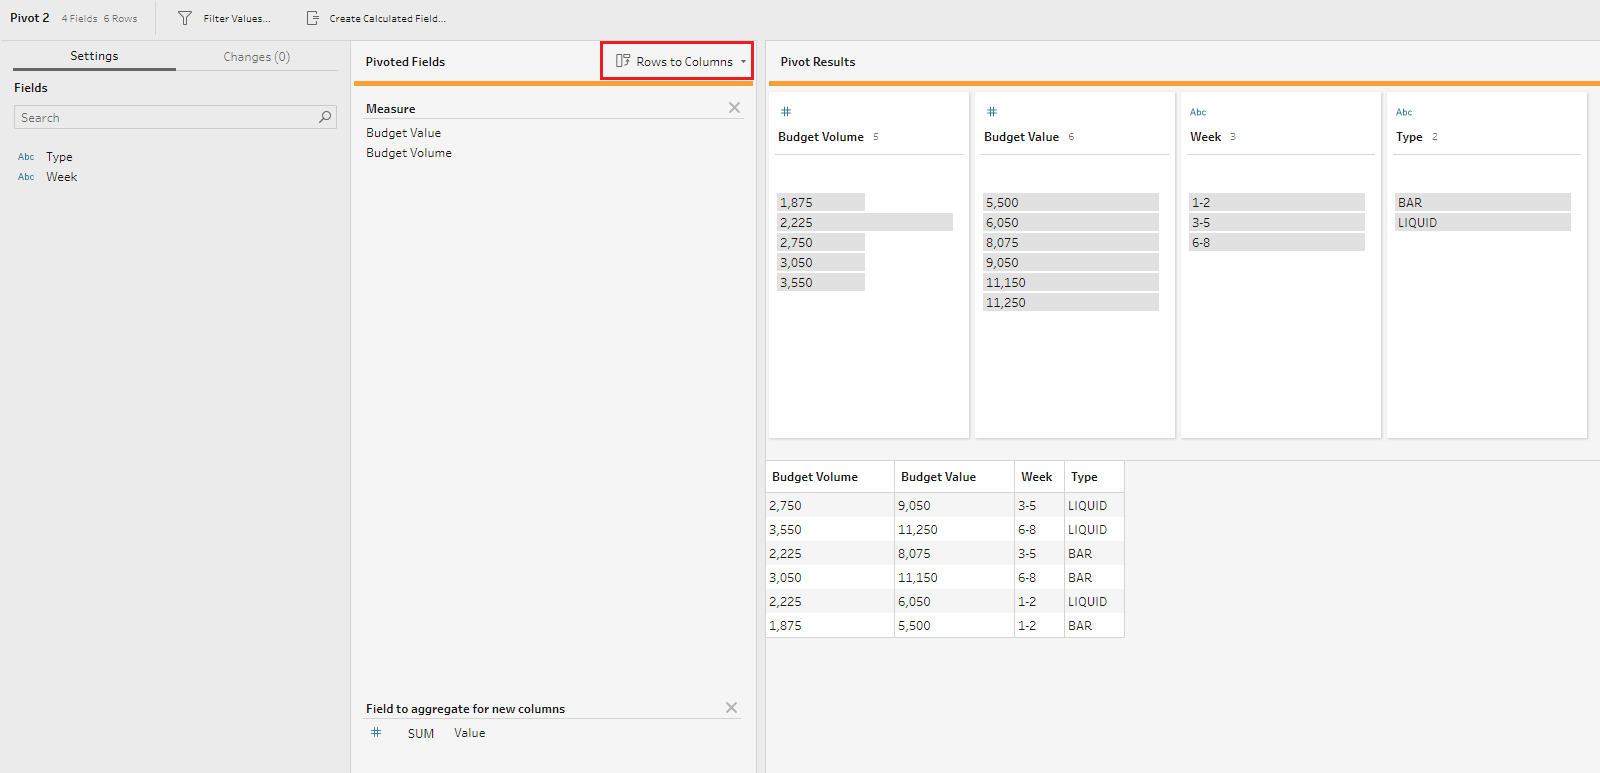
Step 9: Reshaping budget tables - pivoting rows to columns
Now we need to reshape this table again so that the Measure field becomes two separate fields: Budget Volume and Budget Value. For that we need to bring the Pivot step again, but this time use Rows to Columns option, as in the image below.
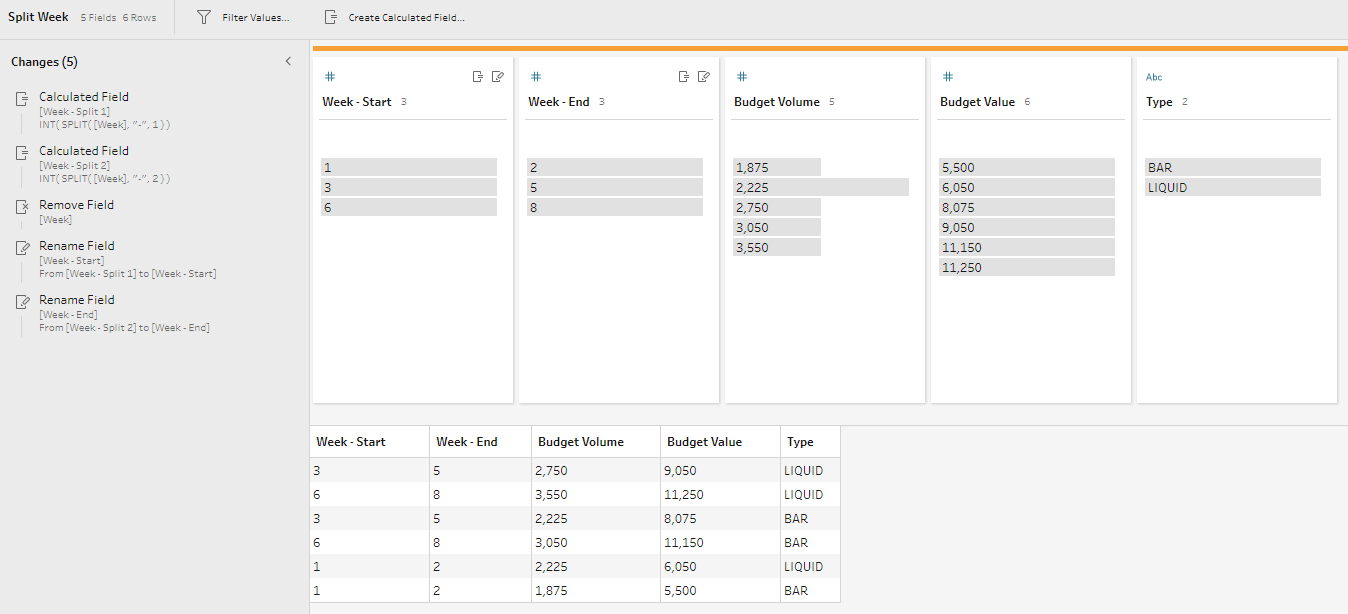
Step 10: Splitting the Week field
Finally, before we can use this budget table for further analysis, we need to split the Week field to have the start and the end of the range in separate fields. Let’s add the Cleaning step after the second pivot, and split the Week field by clicking on the three dots icon in the field’s header and selecting Split Values > Automatic Split. Tableau Prep will split the field using the hyphen as a delimiter, and will create two new fields with lower and upper bounds of the ranges. I renamed these two new fields as Week-Start and Week-End.
Step 11: Identifying weeks where the budget target wasn’t reached
To create the second output for this challenge, we need to use the multi-join functionality again, as in the Step 6 above. However, in this case, we need to join the sales report table with the budget table to only to return the weeks where the budget target wasn’t reached for either value or volume. Multiple clause joins in Tableau Prep evaluate the data based on an AND condition, i.e. all join clauses should be true at the same time to get an output. So, to find in which weeks the budget target wasn’t reached for either value or volume, we need to create two separate joins and then bring the results together.
Join 1: Values
The Join step between the weekly sales figures (see the Step 3 above) and the budgets table should be configured as follows:
- Type field from both tables should be equal
- Budget Value field (from the budgets table) should be more than Sales Value field (from the weekly sales table)
- Week-Start field (from the budgets table) should be less or equal than Week field (from the weekly sales table)
- Week-End field (from the budgets table) should be more or equal than Week field (from the weekly sales table)
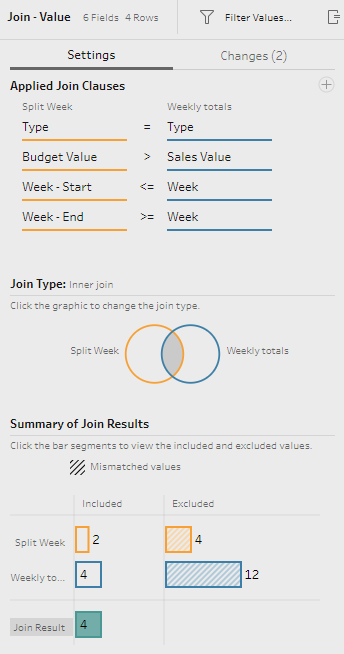
Identifying the weeks where the budget target for values wasn't reached
Join 2: Volumes
The Join step between the weekly sales figures (see the Step 3 above) and the budgets table should be configured as follows:
- Type field from both tables should be equal
- Budget Value field (from the budgets table) should be more than Sales Volume field (from the weekly sales table)
- Week-Start field (from the budgets table) should be less or equal than Week field (from the weekly sales table)
- Week-End field (from the budgets table) should be more or equal than Week field (from the weekly sales table)
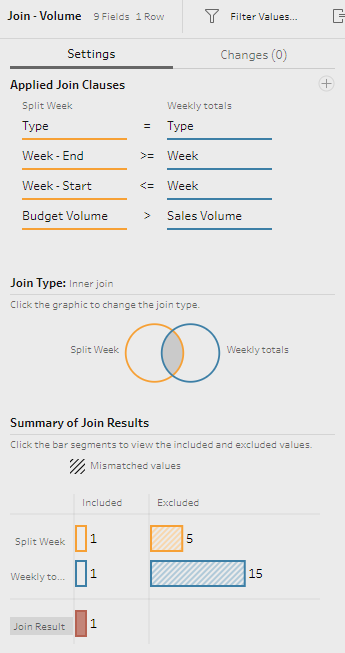
Identifying the weeks where the budget target for volumes wasn't reached
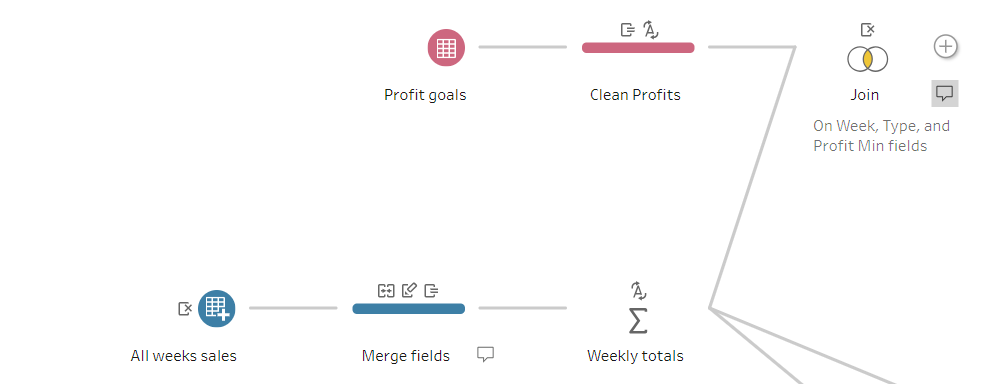
Finally, we need to combine the outputs of these joins together to have the final table. For that, let’s connect these two Join steps with the Union step and remove the Table Names generated field.
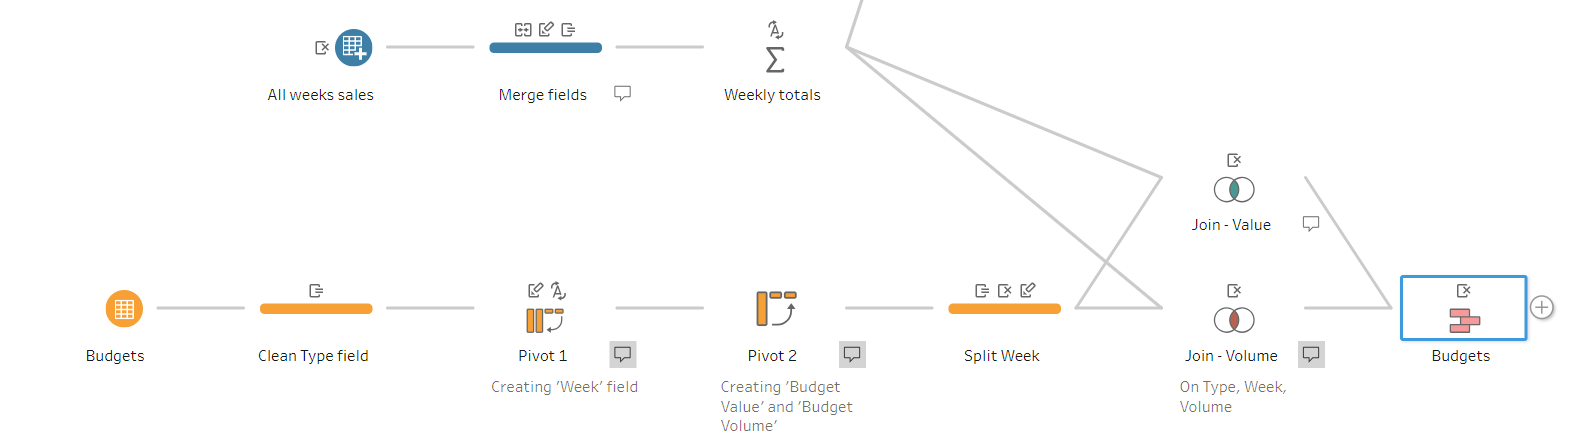
Section of the workflow related to the budgets table
The second output for this challenge should look as follows:
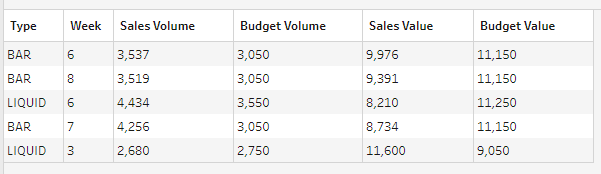
There are 5 weeks where the budget target for either values or volumes wasn't reached
And here is the completed flow for this challenge:
You can download the completed workflow for this challenge in my GitHub repository. Let me know if you have any questions.