Connecting to APIs in Tableau Prep Builder using Python
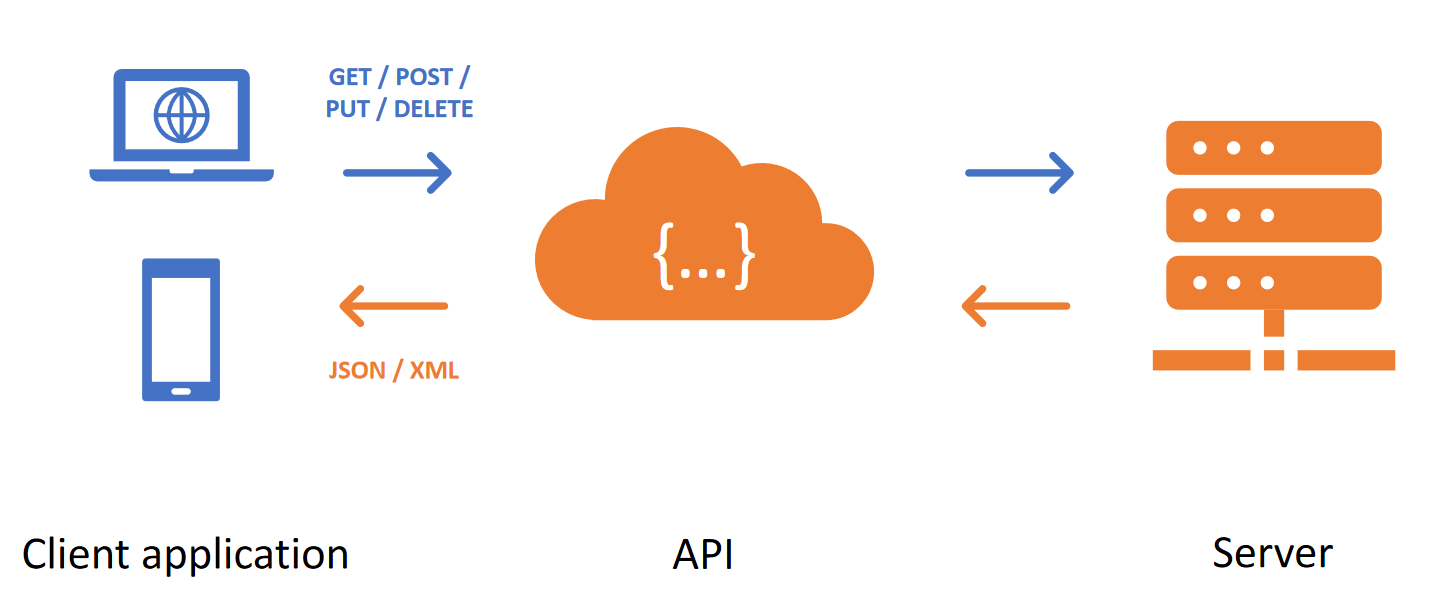
Usually, to work with data in Tableau Prep Builder, we directly connect to a file or a database. But what if we want to add third-party data to our analysis? Sometimes such data comes in the form of static CSV or Excel files that we need to download first and then connect to in Tableau Prep Builder. However, organisations are increasingly making their data available via specifically designed APIs (Application Programming Interfaces). Such APIs allow to programmatically connect to a remote server and retrieve only the data that you are interested in. For example, if you need to analyse intraday stock price data, it’s more efficient to pull the most recent data from a relevant API instead of downloading a static file and refreshing it in your Tableau Prep flow every couple of hours, or even more frequently.
At the time of writing (February 2021), it’s not possible to connect to an API directly from Tableau Prep Builder. However, it can be done by adding a Script step to your workflow, and using a Python or R script to extract the data. In this post I’ll show how to use Python to connect to the Foreign Exchange rates API in Tableau Prep Builder. If you are frequently working with data in different currencies, you can use this API to bring the relevant exchange rates directly into your Tableau Prep workflow to convert all values into the base currency.
The overall process can be divided into six steps:
- Read the API’s documentation
- Build the URL of your request
- Write a Python script with the logic of the request
- Install and launch TabPy server
- Connect Tableau Prep Builder to the TabPy server
- Add the Script step in your Tableau Prep flow to retrieve data from the API
I presented this topic at the Focus on Prep webinar by The Information Lab in November 2020. Here are the webinar’s slides and its recording.
API refresher
Before we start, I wanted to note some main features of APIs to make sure the following explanation is clear for everyone. If you know about APIs, then feel free to scroll further to the first step.
- When we work with APIs, we start by looking at its documentation to understand what data is available to us, if there is a maximum number of requests we can send, whether this API requires authentication or payment, etc. For example, the Foreign Exchange Rates API I use in this project is free and can be accessed as many times as needed without a password.
-
Once we understand the structure of the API and how to access it, we need to form and send our request specifying the data we want to retrieve. These requests can have several methods including GET (to retrieve data from an API server), POST (to send data to an API server), DELETE (to delete data from an API server). For example, in this project we will send a GET request to retrieve EUR to GBP exchange rates for October 2020.
- When the API’s server receives our request, it will send back a short message with a status code, indicating whether the request was successfully received. In short, the code 200 means that the request was successful, the codes between 400 and 499 indicate an issue with the request (incorrectly structured request, issue with authentication or payment, etc.), and the codes between 500 and 599 indicate an error on the API server’s side.
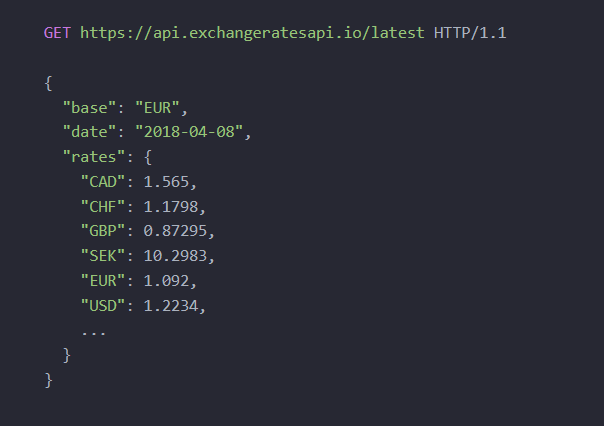
- If our request was successful, the API server’s sends back a response with the requested data. Usually, the response comes in XML or JSON format. In this project, the response comes in JSON format as displayed in the image below. In this format the data is stored in name (a field name in double quotes, e.g. “date”) and value pairs (e.g. “2018-04-08”).
Now let’s see how we can bring the exchange rates data directly into our Tableau Prep flow.
Step 1. Read the API’s documentation
The Foreign Exchange Rates API documentation is just one page outlining the different parameters we can use to build the request URL. We can request the most recent exchange rates, rates for a particular day in the past, or for a set time period. All rates are quoted against Euro by default, but you can change the base currency, if needed, by using the base parameter.
In this project we are interested in extracting exchange rates to convert sales values that happened during October 2020 from Euro to GBP. To achieve this, we need to use the following parameters in the URL:
-
the history parameter to indicate that we are interested in historical rates
-
the symbols parameter to specify that we want to see only the rates for GBP
-
the start_at and end_at parameters to set our time period as October 2020. Notice that the dates should be set in the YYYY-MM-DD format.
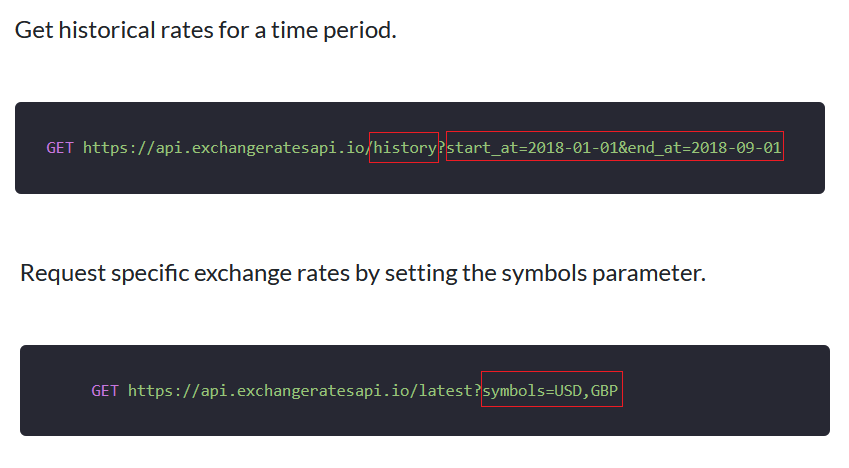
Extract from the API's documentation.
Step 2. Build the request’s URL
Now we can use these parameters to build our request URL, using the ‘&’ sign to combine several parameters. The final URL should look like this:
https://api.exchangeratesapi.io/history?start_at=2020-10-01&end_at=2020-10-31&symbols=GBP
Step 3. Write a Python script with the logic of your request
After we built the URL, we need to include it into the Python script that we will use to send our request to the server and extract the exchange rates.
- First, we import two Python libraries:
- Requests library to connect to the API
- Pandas library to work with tabular data.
import requests
import pandas as pd
- Next, we create a function that sends the request to the API, receives the response, and converts it from JSON into a Pandas data frame, i.e. a table that Tableau Prep understands. In my code this function is called ‘get_exchange_rates’.
def get_exchange_rates(input):
    # connect to the API to get exchange rates for GBP during October 2020. The base currency is EUR.
    response = requests.get("https://api.exchangeratesapi.io/history?start_at=2020-10-01&end_at=2020-10-31&symbols=GBP")
    # create new variable 'rates' for the response from the API
    rates = response.json()
    # create a Pandas dataframe from the 'rates' level of the response
    df=pd.DataFrame(rates['rates'])
    # create a new variable 'rates_table' to hold the dataframe and transpose the table
    rates_table = df.T
    # rename the index column to be called 'Date'
    rates_table=rates_table.rename_axis('Date')
    # turn index to a column
    rates_table.reset_index(inplace=True)
    # rename the 'GBP' column to be called 'EURGBP'
    rates_table = rates_table.rename(columns={'GBP':'EURGBP'})
    # change data types
    rates_table['EURGBP'] = rates_table['EURGBP'].astype('float')
    rates_table['Date'] = rates_table['Date'].astype('str')
    return rates_table
- Before returning the final table from this function, we need to set the data types for every column to make sure that Tableau Prep interprets the data correctly. Here the ‘Date’ field originally comes as an ‘object’ data type, that is specific to Pandas, but cannot be interpreted by Tableau Prep. Also, based on Tableau’s documentation on using Python in Tableau Prep, Date and DateTime data types must always be returned as a valid string. That is why I convert the ‘Date’ field to a string at the very end of the function.
-
If the structure of the table returned from the script is different to the input, you need to add the get_output_schema function to set the structure for the table and the data types. In this project, we don’t have any input table as we need to get data from the API, so we have two options:
- Without the get_output_schema function: As we need to have an Input step to begin our Tableau Prep workflow, we can add a dummy table with the same structure as our output from the API. In this project, the table will have just two columns: ‘Date’ and ‘EURGBP’. You can add any value to these two columns in the dummy input as these values will be replaced by the actual data from the API. In this case, you don’t need to add the get_output_schema function to your Python script.
- With the get_output_schema function: You can add any dummy table as your input to begin a Tableau Prep flow, but you’ll need to include the get_output_schema function to your Python script to define the structure of the output from the Python script. I included this function in my script to give you an example of how it can look like. You can see the full list of available data types and how to specify them in this function on the Tableau Help website.
# define the columns and their data types that are brought into Tableau Prep
def get_output_schema():
    return pd.DataFrame({
        'Date' : prep_string(),
        'EURGBP' : prep_decimal()
    })
Step 4. Install and launch TabPy server
Before we can use our Python script in the Tableau Prep flow, we need to install and launch TabPy, or the Tableau Python Server. It is a framework that allows Tableau to remotely execute Python code. For this project, I installed and run TabPy on my local computer, but you can also install it on its own server, so it is always available to run scripts.
To install TabPy, you need to make sure that you have the following:
- Python (on your local machine or the dedicated server). I used the Anaconda distribution platform which provides an easy way to install and manage different Python packages and versions.
- Pip. It’s a package installer for Python.
Once I had these in place, I installed TabPy as a package by opening the Anaconda prompt and running this request:
pip install tabpy
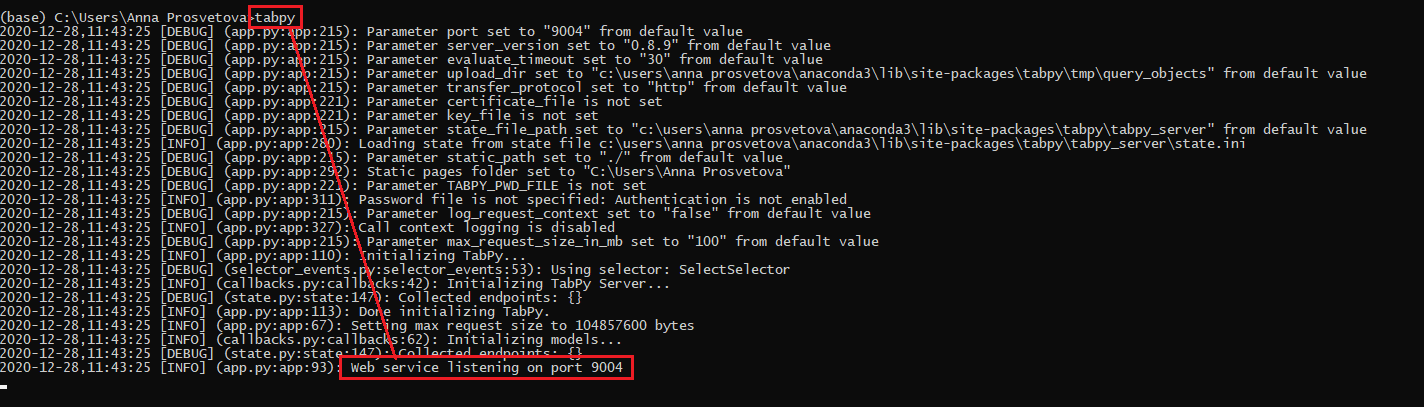
To launch TabPy with default settings I run the following command in the Anaconda prompt:
tabpy
Once TabPy is up and running, you will see this message: ‘Web service listening on port 9004’. This is a default port for TabPy, and we will need it to establish the connection between TabPy and Tableau Prep Builder in the next step.
Click on the image to open the full-sized version.
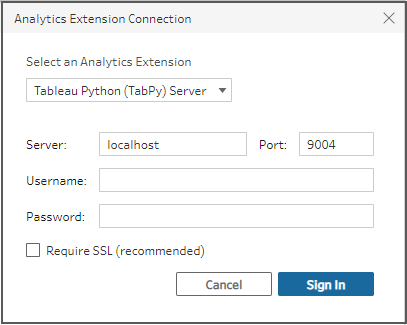
Step 5. Connect Tableau Prep Builder to the TabPy server
After TabPy is launched, we can connect Tableau Prep Builder to it to run Python scripts in our flows. Here is how to do it:
- In Tableau Prep Builder, select Help > Settings and Performance > Manage Analytics Extension Connection from the top menu.
- In the Select an Analytics Extension drop-down list, select the Tableau Python (TabPy) Server option, and enter the server’s name and credentials, if required.
- As I run TabPy on my local machine, I put ‘localhost’ as my server, and no username or password.
- Make sure to include the correct port in this dialogue (port 9004 is the default port for TabPy as we saw in the previous step).
Connecting to TabPy server in Tableau Prep Builder
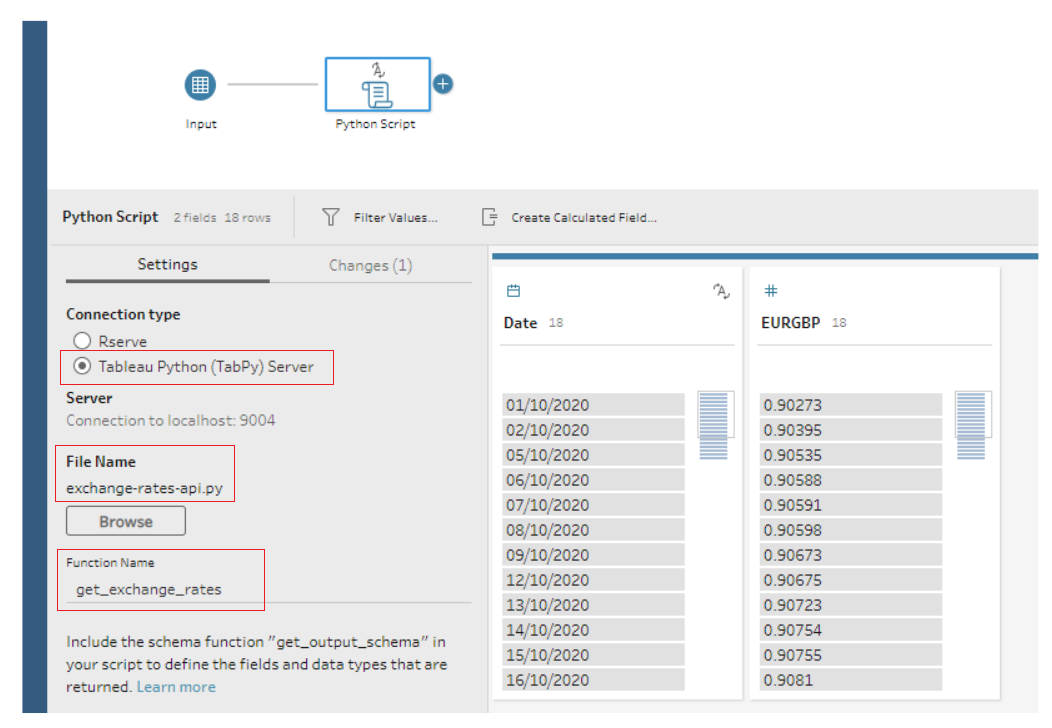
Step 6. Add the Script step in your Tableau Prep flow to see the response from the API
Now we are all set to finally add the Python script to our workflow. As we are going to bring the data from the API, we don’t have input data yet. However, Tableau Prep requires an Input step at the beginning of any flow, whether you are using a Script step or not. To satisfy this requirement, we can create a dummy input table, and add the Script step after it. See Step 3 above for more details on the dummy input options.
Here is how to configure the Script step:
- Connection type should be set to Tableau Python (TabPy) Server
- In the File name option click the Browse button, and select the Python script you will use.
- Include the name of the function from the Python script in the Function Name option. In our case, it should be get_exchange_rates. Note that we just specify the name of the option here rather than calling it with end parentheses.
Click on the image to open the full-sized version.
Once you have entered these details, the script will run automatically. You should now have a table with EUR to GBP exchange rates for October 2020 which can be used further in the flow. Let me know if you have any questions.
You can find my final code for this project in this GitHub repository.
Useful resourses
- How to use an API with Python (Beginner’s Guide)
- Using Python scripts in Tableau Prep flow
- TabPy documentation on GitHub
- List of public APIs for practising
- Using TabPy with Tableau Prep Conductor