Adjusting zoom levels in Mapbox
I recently worked on a project about diversity across England at MSOA level (Middle Layer Super Output Areas are a geographic hierarchy designed to improve the reporting of small area statistics in England and Wales). Building a scrollytelling map in Mapbox, I wanted to see how the diversity index value is distributed across England as the first step of the story, and then zoom in to different cities in England. However, when I added my shapefile to Mapbox, the data disappeared after I started zooming out to see all England.
View of my original tileset
After reading the documentation, I understood that as my file (or a tileset as it’s referred to in Mapbox) was quite granular, Mapbox didn’t render the data at all zoom levels to decrease load times.
According to the Mapbox documentation, “A zoom level determines how much of the world is visible on a map. Mapbox provides maps in 23 zoom levels, with 0 being the lowest zoom level (fully zoomed out) and 22 being the highest (fully zoomed in). At low zoom levels, a small set of map tiles covers a large geographical area. At higher zoom levels, a larger number of tiles cover a smaller geographical area.”
You can check the zoom extent for you tileset when you go to Studio > Tilesets, and select the tileset that you want to check. Zoom extent details are shown in the lower left corner of the screen:
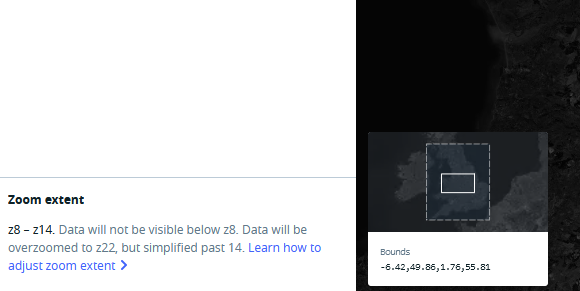
Zoom extent of my original tileset
As you can see from the image above, my tileset will not be visible above the zoom level of 8, but I want to see the data at the zoom level of 4 or 5 (when I can see all England). To keep the data at all zoom levels, I need to adjust the zoom extent of the tileset following the steps below.
1. Convert your shapefile to a line-delimited GeoJSON
First step is to make sure that your geographical data is coming in the correct format. Thank you to Dan Farmer for helping me with figuring this out!
-
Convert the shapefile to a line-delimited GeoJSON using ogr2ogr library (part of GDAL tools). As I work on Windows, I used Windows Subsystem for Linux, opened Ubuntu and typed this line to install the library:
conda install -c conda-forge gdal -
Once the library is installed, navigate to the folder where the shapefile you need to adjust is stored, and run the following command to convert it to a line-delimited GeoJSON:
ogr2ogr -f GeoJSONSeq output_file input_fileFor example, in my case the original file is called Simpson_Index_MSOA.shp, and the new file is msoa_new.ld.
ogr2ogr -f GeoJSONSeq msoa_new.ld Simpson_Index_MSOA.shp
2. Adjust the zoom level using Tippecanoe
Now we are ready to adjust the zoom extent of the new GeoJSON file. When working with Mapbox, there are two techniques you can use to do it:
- Mapbox Tiling Service (MTS) to create a tileset using a recipe that specifies the zoom extent.
- Tippecanoe to transform the data to MBTiles before uploading it to your Mapbox account.
If for some reason you need to use the MTS option, keep an eye on the size of the final file and your Mapbox invoices, especially if you using a free tier. When you upload a file using MTS, you are using Tileset Hosting and will be charged for an upload and storage of such files.
An easy way to spot tilesets that you could be charged for is to look at the Tilesets page in your Mapbox account, and identify any tileset that doesn’t have the label “Created in Studio” or “Created during Preview” (ones that do have those labels are free and don’t count towards your free limit).
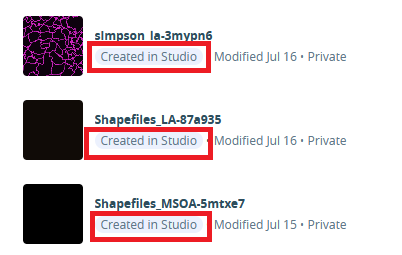
Tilesets uploaded manually via Mapbox Studio
When you use Tippecanoe, you need to upload your files manually to Mapbox Studio, i.e. they will be created in the Studio and shouldn’t lead to any additional charges.This is the method I’m going to use.
-
Let’s start with installing Tippecanoe, using Ubuntu under Windows Subsystem for Linux:
git clone https://github.com/mapbox/tippecanoe.git cd tippecanoe make -j make install -
Now adjust the zoom level and convert the GeoJSON file into an .mbtiles format:
tippecanoe -o output-file -Z 0 -z 9 input_fileFor example, in my case my GeoJSON file created in the steps above is called simpson_msoa_new.ld, and the new file is simpson_la.mbtiles. In this code I specify that the zoom extent of this file should be between 0 and 9, so it’s visible when I zoom out.
tippecanoe -o simpson_la.mbtiles -Z 0 -z 9 simpson_msoa_new.ld
3. Upload the new file to Mapbox
The final step is to upload the new .mbtiles file to Mapbox from the Tilesets section in the Studio.
-
Login to your account on Mapbox website, go to Tilesets in the top right corner, click New tileset button, and upload the .mbtiles file.
-
Once the tileset is uploaded, it will appear in the Custom tilesets section on the Tilesets page, and the data should be displayed at all zoom levels set up with Tippecanoe.
New tileset with adjusted zoom levels
Let me know if you have any questions about the process. Happy mapping!