Preppin' Data 2020: Week 9 challenge solution
Here is my solution for Peppin’ Data 2020, Week 9. In this challenge we looked at US Election poll results from RealClearPolitics.com. The goal for the challenge was to clean and prepare the data so it can be used to visualise poll results as a bump chart in Tableau Desktop.
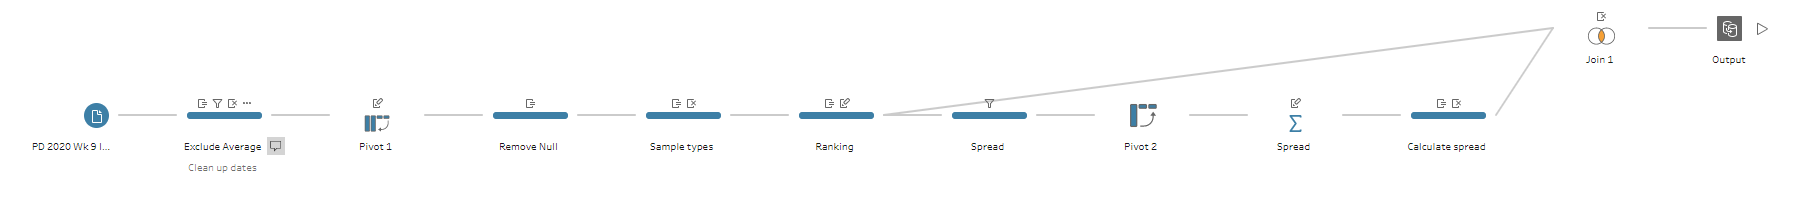
My solution in Tableau Prep
Original challenge and data set on Preppin’ Data’s blog.
Step 1: Cleaning up the dates
As you can see from the input table, the Date field has two dates — for the beginning and end of a poll — but for the final output we need to keep only the end date for each poll.
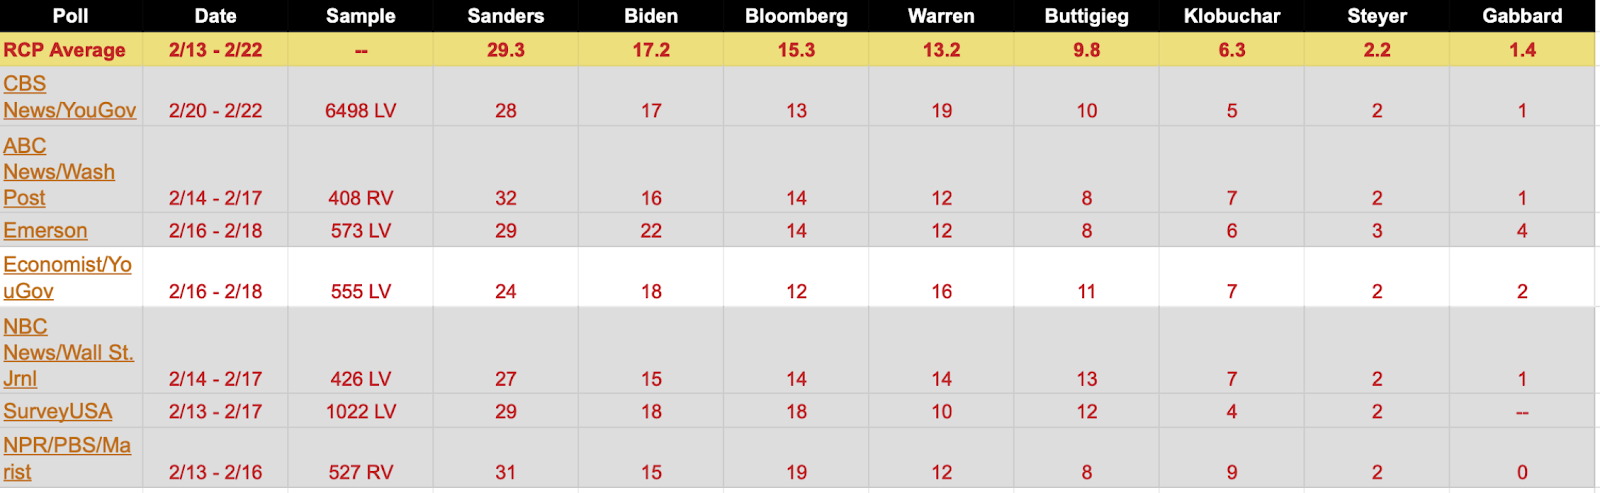
Extract from the original table with poll results
Let’s start with adding a Cleaning step after the input, and filtering out the RCP Average value from the Poll field as it won’t be used in further calculations.
Now we need to split the Date field using the Custom Split function with ’ - ‘ as separator, and splitting off the last field, i.e. the end date. Rename the new field Date - Split 1 as End Date, and remove the original Date field.
However, the End Date field is still missing an important part - the poll’s year, as some polls took place in 2019 (in December), and some - in 2020 (in January and February). To add the year to the date, we need to update the End Date field by creating the following calculated field called End Date:
IF STARTSWITH([End Date], '2/') OR STARTSWITH([End Date], '1/') THEN [End Date]+'/2020' ELSE [End Date]+'/2019' ENDTo conclude this step, we need to change the data type of the End Date field to Date.
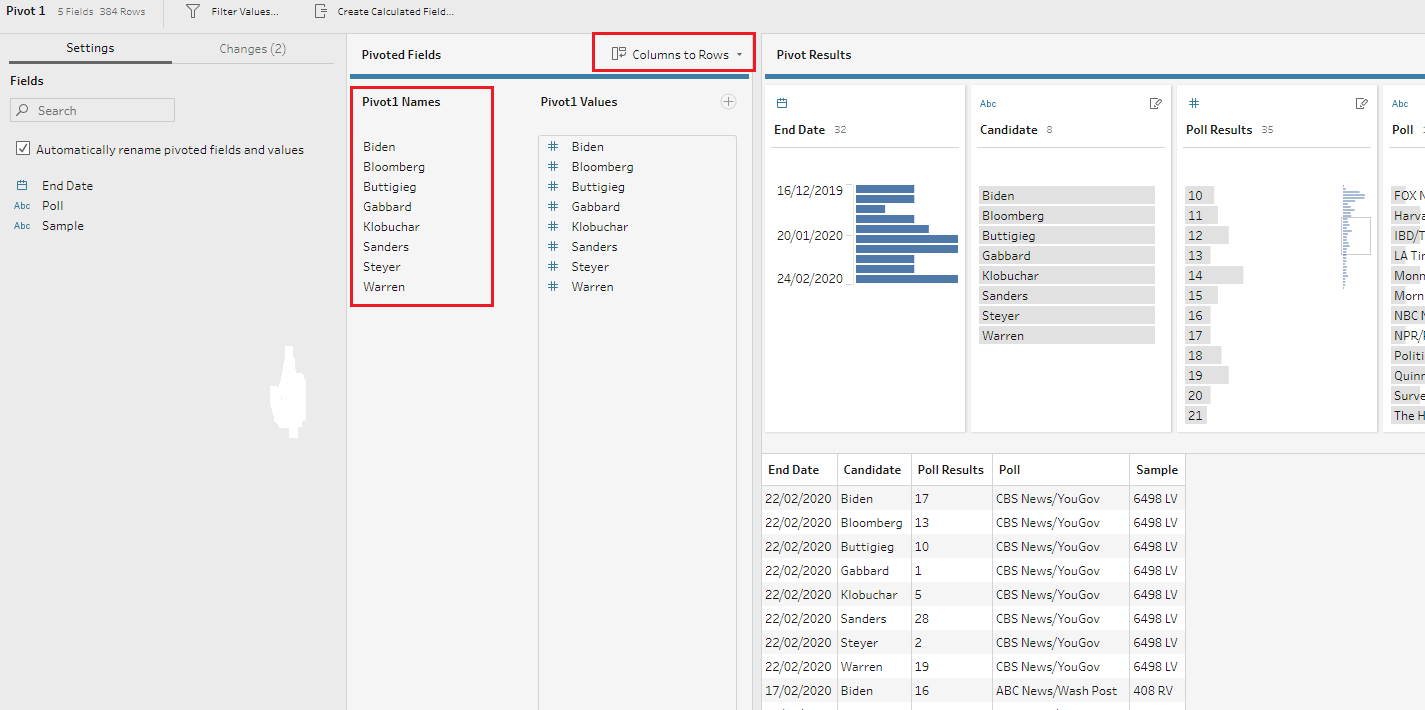
Step 2: Re-shaping the table
The next step is to re-shape the table so instead of individual fields for each candidate’s results, we have two fields: one for a candidate’s name, and another for the poll results. To do so, let’s: bring the Pivot step, drag all the fields for individual candidates to the Pivoted Fields section, and pivot the table using the Columns to Rows option. To conclude, let’s rename the Pivot1 Names field as Candidate, and Pivot1 Values field as Poll Results.
Step 3: Removing NULLs and creating the Sample Type field
Next step is to take care of NULL values in the Poll Result field. Sometimes the NULL values should be simply filtered from a dataset, but in this case we need to convert any NULL poll results into zero so they can be used in calculations. For that, let’s update the Poll Results field with the following calculated field:
ZN([Poll Results])Here the function ZN returns the value of the Poll Results field if it’s not NULL, otherwise it returns zero.
Next let’s create the Sample Types field with a new calculated field:
IF CONTAINS([Sample], 'RV') THEN 'Registered Voter' ELSEIF CONTAINS([Sample], 'LV') THEN 'Likely Voter' ELSE 'Unknown' ENDNow we can remove the Sample field.
Step 4: Ranking candidates in each poll
Now let’s create a rank for each candidate in each poll using the new RANK function available in Tableau Prep Builder 2020.1. This function is available either from a calculated field or from a newly introduced visual calculations window. To use this new functionality, click on the three dots icon in any field’s header, and select Create Calculated Field > Rank option.
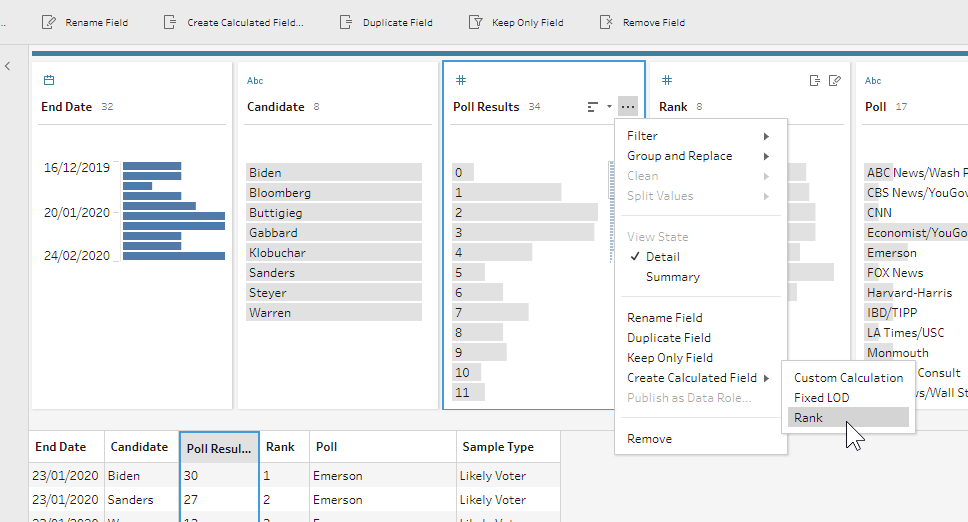
In the new dialogue window we need to determine how to calculate the rank. It should be grouped by Poll and End Date fields, and ranked by the Poll Results values. Rename the newly created field as Rank.
Ranking using the new visual calculations window
Step 5: Calculating the spread between 1st and 2nd places
Now the last bit of the challenge is to calculate the difference between 1st and 2nd places for each poll. To do so, I first filtered out all values from the field Rank, leaving only ‘1’ and ‘2’.
Next, I added the Pivot step, and this time pivoted the table using the Rows to Columns option, pivoting the Rank field and aggregating the values from the Poll Results field (using the SUM aggregation).
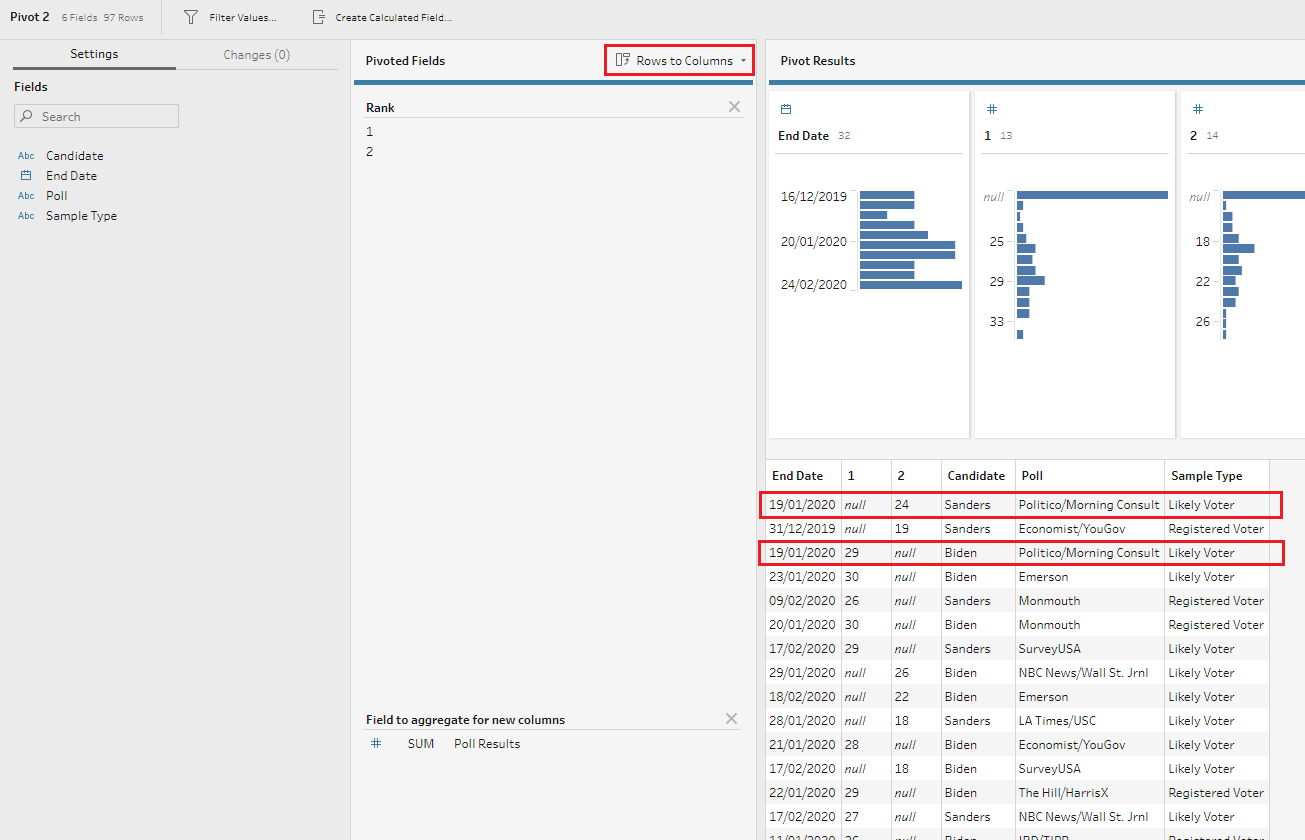
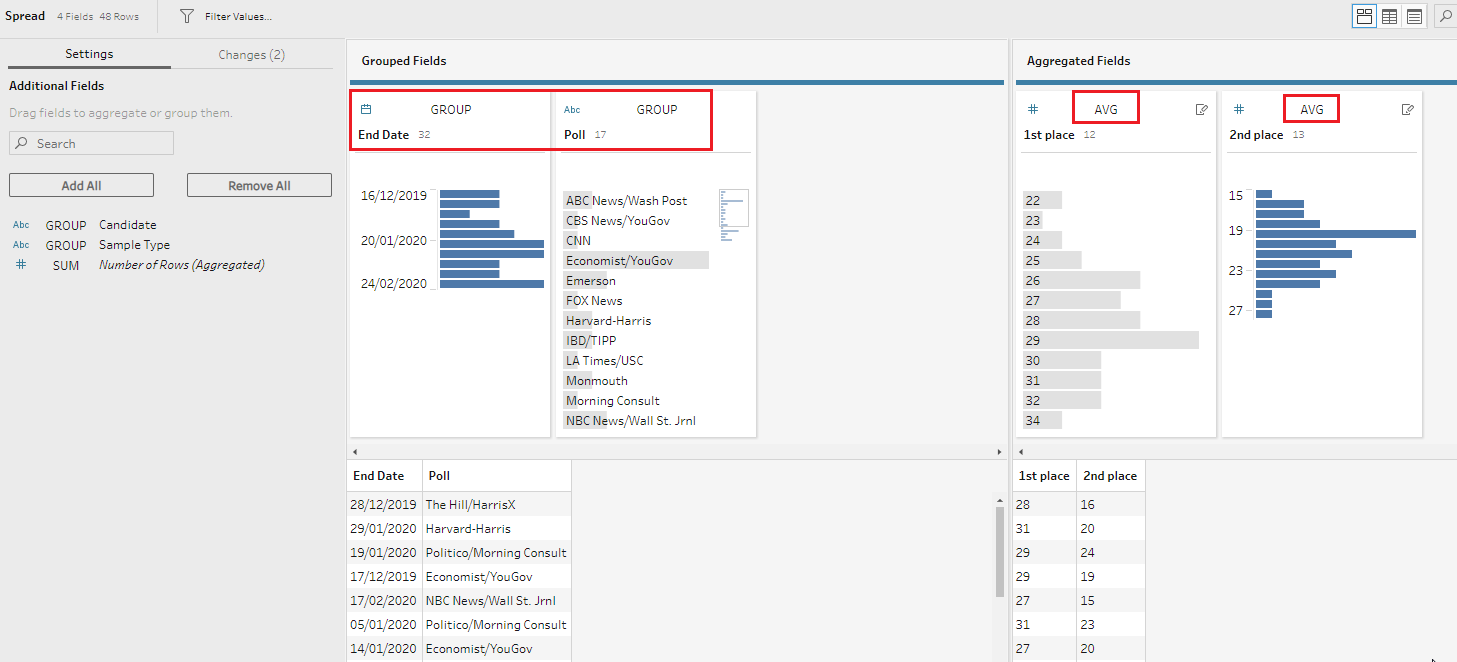
Now I had 1st place and 2nd place as individual fields, but there were some NULL values as the candidate who ranked first doesn’t have any values in the field 2nd Place, and the other way around (see an example highlighted in red in the image above). To fix this, I added the Aggregate step, and grouped the data by End Date and Poll fields. I aggregated the 1st place and 2nd place fields using AVG aggregation as there are polls where several candidates came 2nd, so the average gives a correct number here while the SUM would inflate the final number.
Now we just need to calculate the difference between the 1st and the 2nd place by creating a new calculated field called Spread from 1st to 2nd place:
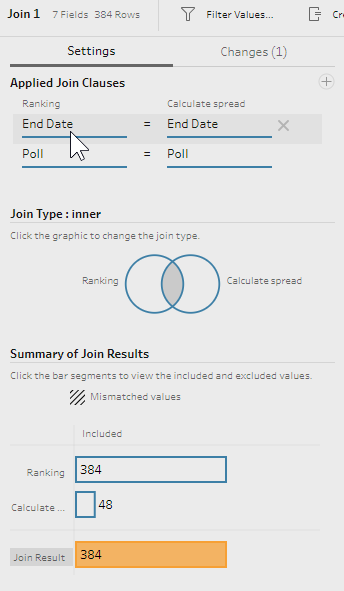
[1st place]-[2nd place]Now, to get the final output, we need to join this result to our main table on two fields: End Date and Poll.
Our final output is ready:
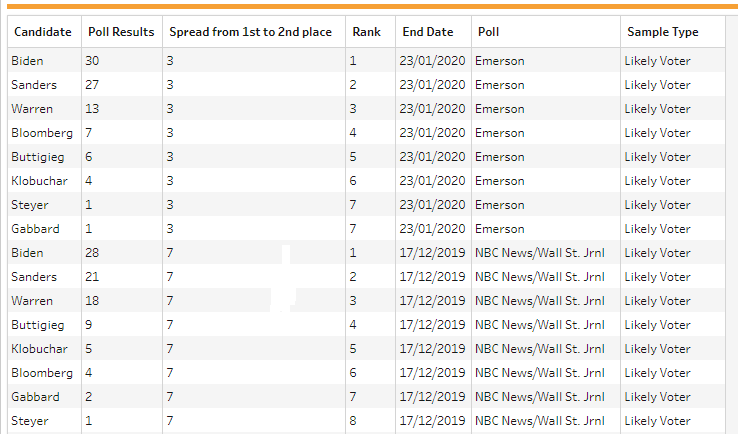
Final output table
And here is the completed flow for this challenge which you can download from my GitHub repository:
If you want to take this challenge further, read my post on how to build a bump chart which you can use as a starting point to visualise the cleaned poll results data.